Embracing Disruption

Supercharging clean energy storage capacities
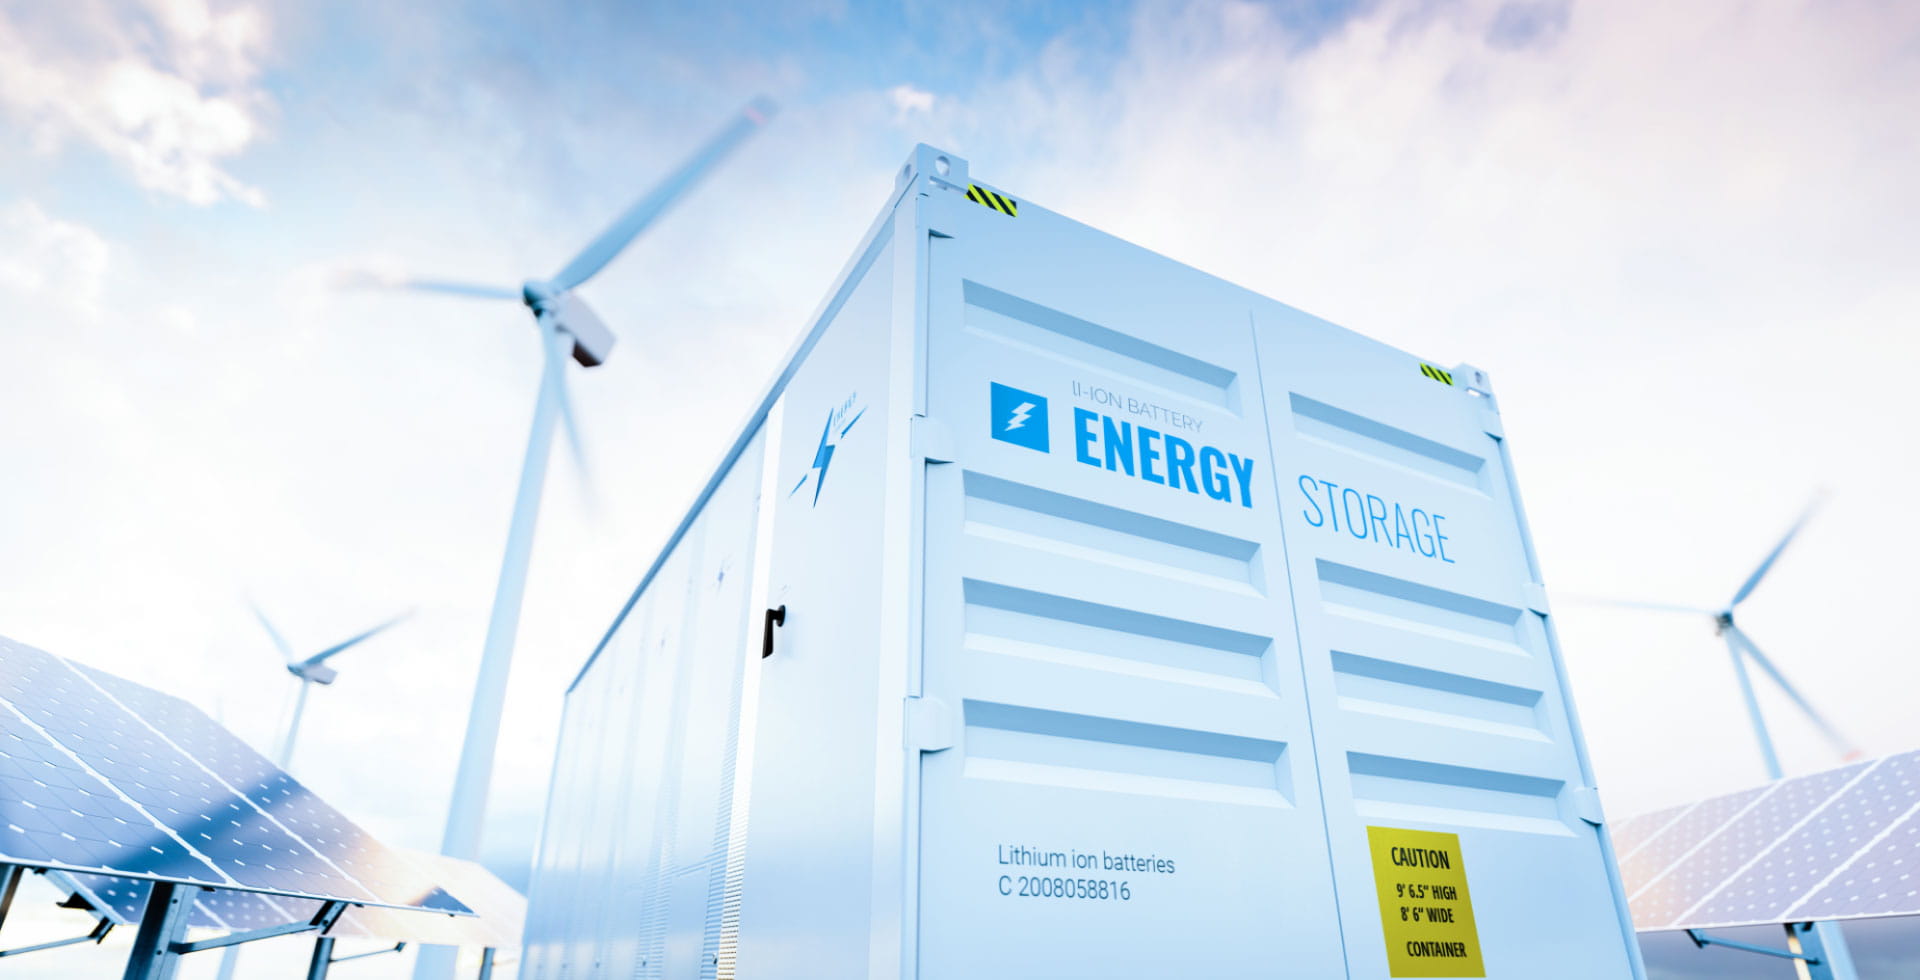
Geopolitical disruptions and increasing extreme weather events around the globe highlight more clearly than ever the urgent need to further step up the clean energy transition. Large scale and flexible energy storage systems are creating the necessary backbone infrastructure to integrate growing renewable capacities. This transition helping to decrease the dependency from fossil fuels while facilitating the energy transition.

Key takeaways
  • Building up clean energy storage capacities is crucial to the decarbonisation of energy system offering more flexibility and helping to decrease dependency from volatile fossil fuel prices
  • Clean energy storage secures grid stability, and facilitates/accelerates the integration of renewables into the energy market
  • Global battery energy storage market is projected to show a double-digit growth by the end of this decade

How energy storage can help stabilising the balance between energy supply and demand

Following a recent report of the International Energy Agency (IEA) renewable energy is set to be the dominant source of electricity by 2025, covering 90% of new capacity between now and the mid of this decade.1 Thanks to a record growth in renewable energy capacity and output, clean energy production will also be able to keep pace with the globally rising demand. However, natural energy sources such as solar, wind and water are subject to fluctuations (intermittency) which can confine their efficiency. Clean energy storage systems can secure grid stability and enhance the reliability of (green) energy supply as they allow to store excess energy and distribute it later, whenever needed.

Thus, keeping energy supply and demand in equlibrium by further enhancing energy storage capacities serves as a catalyst for the further growth of clean energy generation.

Global cumulative energy storage is expected to reach 2,850GWh by 2040
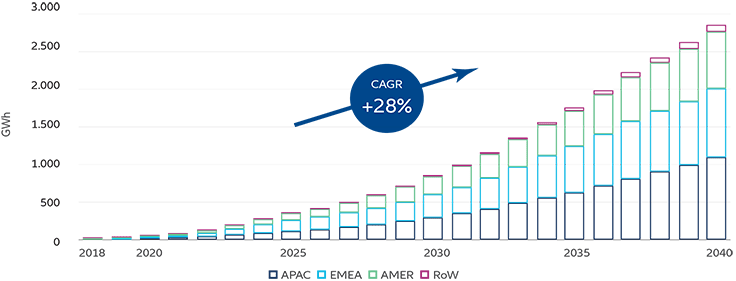

Source: Energy Storage Outlook 2019, BNEF 2019 July.

The variety of energy storage systems

Storing energy and ensuring availability on demand is critical for the electrification of industries, transport and households. However, to achieve this, original sources of energy need to be converted and then re-converted into electrical energy for storage. Below we discuss different mechanisms to achieve this:

The variety of energy storage systems - infographic

Within these groups some options are most widely deployed to store large quantities of electricity.

Pumped hydro

In times of flat demand, water is pumped from lower to higher reservoirs. When demand surges, water is released to operate a turbine and delivering electricity to the grid.

Pumped hydropower storage
Grid-scale batteries

Electrochemical devices (lithium-ion, lead-acid, redox flow, etc.) that accumulate energy from the grid/power plant when electricity is plentiful and cheap and then discharge that energy later to provide electricity when required.
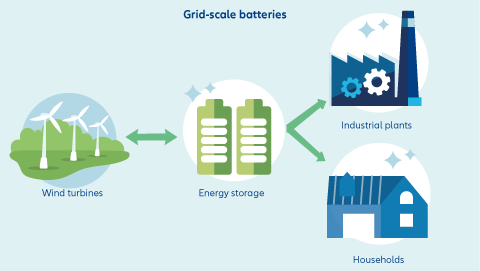
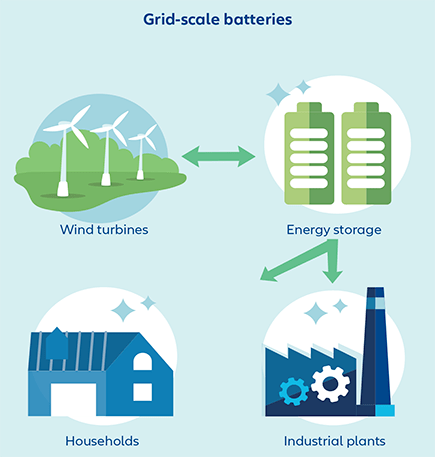
Grid-scale batteries - infographic
Solar thermal systems

Collection of energy by solar fields/photovoltaic systems that is discharged when demand is high and solar input low.

Solar thermal systems - infographic

Hydrogen

Conversion of electricity into hydrogen which is then stored and re-converted into electricity. Although today its efficiency is still below other forms of storage systems, interest in hydrogen storage solutions – and here especially in Ammonia as a hydrogen carrier - is rising due to the significantly higher storage capacities than batteries, hydro or solar thermal technologies.

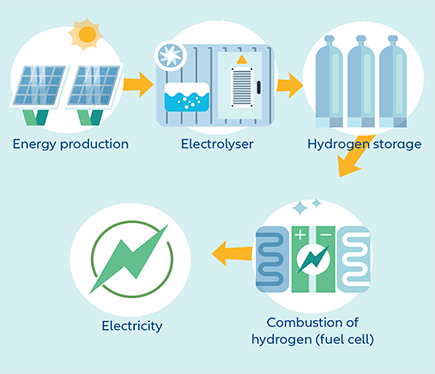
Hydrogen infographic

Tackling the challenges of energy storage systems

Despite the indisputable advantages energy storage systems and technologies add up to the clean energy transition, there are still high obstacles that must be overcome to establish the storage of clean energy as one of the main drivers of the transition to more sustainable forms of energy.

Obstacles to overcome - infographic
Energy storage, an indispensable part of clean power additions

While the global drive to decarbonise energy production and industries is predominantly focused on energy production, energy storage is gradually establishing itself as mission critical part of this transitional process.

Consequently, more and more governments and entities around the globe have recognised the need for action and implemented measures to foster the capacity expansion of energy storage systems as well as to intensify and finance the research and development of alternative technological storage solutions.

USA

On 1 January 2023 the Investment Tax Credit (ITC) under the Inflation Reduction Act (IRA) was extended to 5kWh or more stand-alone energy storage projects.2 Making these smaller scale projects eligible for an ITC disconnects developers from the need of coupling their storage solution directly with photovoltaic systems. This in turn reduces development times and costs for new energy storage capacities significantly.

This newly gained flexibility and the expansion of Investment Tax Credits to stand-alone energy storage systems might help to further push the already constantly growing US energy storage market.
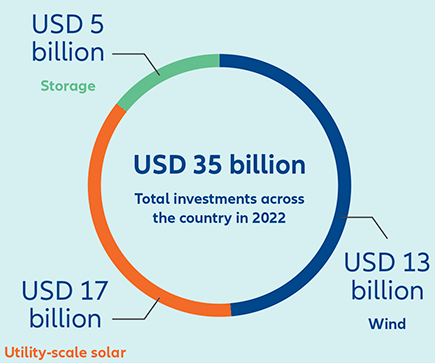
Donut Chart - infographic

Source: American Clean Power CLEAN POWER ANNUAL MARKET REPORT 2022, May 2023


Regional focus

New York State

New York State’s energy storage targets of 1,500 MW by 2025 and 3,000 MW by 2030 could not only result in roughly USD 3 billion in gross benefits but could also avoid more than two million metric tons of CO2 emissions and create around 30,000 jobs by 2030.3

California and Texas

In 2022, the “Golden State” and the “Lone Star State” took the top two places for US-wide clean energy additions including storage capacities.4

Texas and California, frontrunners in clean power additions in 2022

Texas and California, frontrunners in clean power additions in 2022 - infographic

Source: American Clean Power CLEAN POWER ANNUAL MARKET REPORT 2022, May 2023

EU

On March 2023, the European Commission published a recommendation on energy storage highlighting that it can “play a crucial role in decarbonising the energy system, contributing to energy system integration and security of supply” and also stating that “a decarbonised energy system will require significant investment in storage capacity of all forms.”6 In this context EU member states are recommended to make detailed data accessible to facilitate investment decisions on new energy storage facilities.

EU’s push to build up energy storage capacities comes at the right time as the Commission assessed that the need for electricity system flexibility could grow to 30% of total electricity demand by 2050, a plus of 11% compared to 2021.

Latin America

According to recent analysis, in 2022 the solar energy storage market in Latin America amounted to USD 1.84 billion. Within the next five years it is set to grow at an annual rate of 7.20%.5

Investment in enablers can help scaling up clean energy storage capacities

With energy produced from renewable sources gradually and globally overtaking fossil fuel power and while new clean energy installations are hitting record levels, the step-up and speed-up of building additional storage capacities is becoming even more crucial to steadily supply reliable clean energy.

Forecasts for the growth of global energy storage range between 80GW and 88 GW of new installations per year7 . Despite the actual and predicted boost of storage capacities, an even larger quantity is needed to increase the reliability and uptime and overcome the intermittency of solar, wind and hydro energy. Therefore, additional investments along the whole energy-storage value chain are required to help putting the proportion of clean energy production and energy storage in balance and address the ever-increasing demand for energy storage solutions.

These investments would very probably fall on fertile ground. A recent analysis predicts that the global battery energy storage market is set to increase from USD 10.88 billion in 2022 to USD 31.20 billion by 2029, growing at a double-digit pace of 16.3% in the forecast period.8

Considering this staggering growth, directing financial flows to dedicated companies can offer various promising angles for investors: the well-funded research on novel performance-enhancing materials can speed up the development and marketability of pioneering energy collecting technologies. This, finally, could substantially shape the vital co-evolution of clean energy production and energy storage.

Storing Energy remains a giant undertaking over the coming years and is creating multiple investment opportunities. Several use cases need different forms best fitting their individual needs requiring different forms of technical solutions. This speaks to the broad opportunities and solutions through the entire value chain.

1 International Energy Agency: Renewable power’s growth is being turbocharged as countries seek to strengthen energy security. December 2022
2 Congress.gov: Energy Storage Tax Incentive and Deployment Act of 2021. September 2021
3 New York State: Types of Energy Storage
4 American Clean Power Market Report 2022, May 2023
5 Digitaljournal.com: Latin America Solar Energy Storage Market Shows Robust Growth Potential
6 EU Commission recommendation on Energy Storage – Underpinning a decarbonised and secure EU energy system. 14 March 2023
7 Bloomberg NEF: 1H 2023 Energy Storage Market Outlook. March, 2023 and International Energy Agency: Grid-Scale Storage. September 2022
8 Fortunebusinessinsights.com: Global battery energy storage market. March 2022

  • Disclaimer
    Information herein is based on sources we believe to be accurate and reliable as at the date it was made. We reserve the right to revise any information herein at any time without notice. No offer or solicitation to buy or sell securities and no investment advice or recommendation is made herein. In making investment decisions, investors should not rely solely on this material but should seek independent professional advice. Investment involves risks, in particular, risks associated with investment in emerging and less developed markets. Past performance, or any prediction, projection or forecast, is not indicative of future performance. This material and website have not been reviewed by the Securities and Futures Commission of Hong Kong. Issued by Allianz Global Investors Asia Pacific Limited.

Recent insights

Navigating Rates

With the potential for more frontloading of interest rate cuts by the European Central Bank, we see the possibility of further yield curve steepening, primarily from the more policy-anchored front end. In outright duration risk, we prefer to stay more tactical on US Treasuries.

Discover more

Navigating Rates

With all signs pointing to a Donald Trump win, we expect many of his populist policies to cause ripples, even though markets were largely priced for this outcome. How might investors navigate the election result?

DISCOVER MORE

Navigating Rates

All eyes will be on the US elections in November – but the implications for markets could be quite different depending on who wins.

Discover more

Allianz Global Investors

You are leaving this website and being re-directed to the below website. This does not imply any approval or endorsement of the information by Allianz Global Investors Asia Pacific Limited contained in the redirected website nor does Allianz Global Investors Asia Pacific Limited accept any responsibility or liability in connection with this hyperlink and the information contained herein. Please keep in mind that the redirected website may contain funds and strategies not authorized for offering to the public in your jurisdiction. Besides, please also take note on the redirected website’s terms and conditions, privacy and security policies, or other legal information. By clicking “Continue”, you confirm you acknowledge the details mentioned above and would like to continue accessing the redirected website. Please click “Stay here” if you have any concerns.

Welcome to Allianz Global Investors

Select your language
  • 中文(繁體)
  • English
Select your role
  • Individual Investor
  • Intermediaries
  • Other Investors
  • Pension Investors
  • Allianz Global Investors Fund (“AGIF”)

    • Allianz Global Investors Fund (“AGIF”) as an umbrella fund under the UCITS regulations has within it different sub-funds investing in fixed income securities, equities, and derivative instruments, each with a different investment objective and/or risk profile.

    • All sub-funds (“Sub-Funds”) may invest in financial derivative instruments (“FDI”) which may expose to higher leverage, counterparty, liquidity, valuation, volatility, market and over the counter transaction risks. A Sub-Fund’s net derivative exposure may be up to 50% of its NAV. 

    • Some Sub-Funds as part of their investments may invest in any one or a combination of the instruments such as fixed income securities, emerging market securities, and/or mortgage-backed securities, asset-backed securities, property-backed securities (especially REITs) and/or structured products and/or FDI, exposing to various potential risks (including leverage, counterparty, liquidity, valuation, volatility, market, fluctuations in the value of and the rental income received in respect of the underlying property, and over the counter transaction risks). 

    • Some Sub-Funds may invest in single countries or industry sectors (in particular small/mid cap companies) which may reduce risk diversification. Some Sub-Funds are exposed to significant risks which include investment/general market, country and region, emerging market (such as Mainland China), creditworthiness/credit rating/downgrading, default, asset allocation, interest rate, volatility and liquidity, counterparty, sovereign debt, valuation, credit rating agency, company-specific, currency  (in particular RMB), RMB debt securities and Mainland China tax risks. 

    • Some Sub-Funds may invest in convertible bonds, high-yield, non-investment grade investments and unrated securities that may subject to higher risks (include volatility, loss of principal and interest, creditworthiness and downgrading, default, interest rate, general market and liquidity risks) and therefore may adversely impact the net asset value of the Sub-Funds. Convertibles will be exposed prepayment risk, equity movement and greater volatility than straight bond investments.

    • Some Sub-Funds may invest a significant portion of the assets in interest-bearing securities issued or guaranteed by a non-investment grade sovereign issuer (e.g. Philippines) and is subject to higher risks of liquidity, credit, concentration and default of the sovereign issuer as well as greater volatility and higher risk profile that may result in significant losses to the investors. 

    • Some Sub-Funds may invest in European countries. The economic and financial difficulties in Europe may get worse and adversely affect the Sub-Funds (such as increased volatility, liquidity and currency risks associated with investments in Europe).

    • Some Sub-Funds may invest in the China A-Shares market, China B-Shares market and/or debt securities directly  via the Stock Connect or the China Interbank Bond Market or Bond Connect and or other foreign access regimes and/or other permitted means and/or indirectly through all eligible instruments the qualified foreign institutional investor program regime and thus is subject to the associated risks (including quota limitations, change in rule and regulations, repatriation of the Fund’s monies, trade restrictions, clearing and settlement, China market volatility and uncertainty, China market volatility and uncertainty, potential clearing and/or settlement difficulties and, change in economic, social and political policy in the PRC and taxation Mainland China tax risks).  Investing in RMB share classes is also exposed to RMB currency risks and adverse impact on the share classes due to currency depreciation.

    • Some Sub-Funds may adopt the following strategies, Sustainable and Responsible Investment Strategy, SDG-Aligned Strategy, Sustainability Key Performance Indicator Strategy (Relative), Green Bond Strategy, Multi Asset Sustainable Strategy, Sustainability Key Performance Indicator Strategy (Absolute Threshold), Environment, Social and Governance (“ESG”) Score Strategy, and Sustainability Key Performance Indicator Strategy (Absolute). The Sub-Funds may be exposed to sustainable investment risks relating to the strategies (such as foregoing opportunities to buy certain securities when it might otherwise be advantageous to do so, selling securities when it might be disadvantageous to do so, and/or relying on information and data from third party ESG research data providers and internal analyses which may be subjective, incomplete, inaccurate or unavailable and/or reducing risk diversifications compared to broadly based funds) which may result in the Sub-Fund being more volatile and have adverse impact on the performance of the Sub-Fund and consequently adversely affect an investor’s investment in the Sub-Fund. Also, some Sub-Funds may be particularly focusing on the GHG efficiency of the investee companies rather than their financial performance which may have an adverse impact on the Fund’s performance.

    • Some Sub-Funds may invest in share class with fixed distribution percentage (Class AMf). Investors should note that fixed distribution percentage is not guaranteed. The share class is not an alternative to fixed interest paying investment. The percentage of distributions paid by these share classes is unrelated to expected or past income or returns of these share classes or the Sub-Funds. Distribution will continue even the Sub-Fund has negative returns and may adversely impact the net asset value of the Sub-Fund.  Positive distribution yield does not imply positive return.

    • Investment involves risks that could result in loss of part or entire amount of investors’ investment.

    • In making investment decisions, investors should not rely solely on this [website/material].

    Note: Dividend payments may, at the sole discretion of the Investment Manager, be made out of the Sub-Fund’s capital or effectively out of the Sub-Fund’s capital which represents a return or withdrawal of part of the amount investors originally invested and/or capital gains attributable to the original investment. This may result in an immediate decrease in the NAV per share and the capital of the Sub-Fund available for investment in the future and capital growth may be reduced, in particular for hedged share classes for which the distribution amount and NAV of any hedged share classes (HSC) may be adversely affected by differences in the interests rates of the reference currency of the HSC and the base currency of the respective Sub-Fund. Dividend payments are applicable for Class A/AM/AMg/AMi/AMgi/AQ Dis (Annually/Monthly/Quarterly distribution) and for reference only but not guaranteed.  Positive distribution yield does not imply positive return. For details, please refer to the Sub-Fund’s distribution policy disclosed in the offering documents.


    Allianz Global Investors Asia Fund

    • Allianz Global Investors Asia Fund (the “Trust”) is an umbrella unit trust constituted under the laws of Hong Kong pursuant to the Trust Deed. Allianz Thematic Income and Allianz Selection Income and Growth and Allianz Yield Plus Fund are the sub-funds of the Trust (each a “Sub-Fund”) investing in fixed income securities, equities and derivative instrument, each with a different investment objective and/or risk profile.

    • Some Sub-Funds are exposed to significant risks which include investment/general market, company-specific, emerging market, creditworthiness/credit rating/downgrading, default, volatility and liquidity, valuation, sovereign debt, thematic concentration, thematic-based investment strategy, counterparty, interest rate changes, country and region, asset allocation risks and currency (such as exchange controls, in particular RMB), and the adverse impact on RMB share classes due to currency depreciation.  

    • Some Sub-Funds may invest in other underlying collective schemes and exchange traded funds. Investing in exchange traded funds may expose to additional risks such as passive investment, tracking error, underlying index, trading and termination. While investing in other underlying collective schemes (“CIS”) may subject to the risks associated to such CIS. 

    • Some Sub-Funds may invest in high-yield (non-investment grade and unrated) investments and/or convertible bonds which may subject to higher risks, such as volatility, creditworthiness, default, interest rate changes, general market and liquidity risks and therefore may  adversely impact the net asset value of the Fund. Convertibles may also expose to risks such as prepayment, equity movement, and greater volatility than straight bond investments.

    • All Sub-Funds may invest in financial derivative instruments (“FDI”) which may expose to higher leverage, counterparty, liquidity, valuation, volatility, market and over the counter transaction risks.  The use of derivatives may result in losses to the Sub-Funds which are greater than the amount originally invested. A Sub-Fund’s net derivative exposure may be up to 50% of its NAV.

    • These investments may involve risks that could result in loss of part or entire amount of investors’ investment.

    • In making investment decisions, investors should not rely solely on this website.

    Note: Dividend payments may, at the sole discretion of the Investment Manager, be made out of the Sub-Fund’s income and/or capital which in the latter case represents a return or withdrawal of part of the amount investors originally invested and/or capital gains attributable to the original investment. This may result in an immediate decrease in the NAV per distribution unit and the capital of the Sub-Fund available for investment in the future and capital growth may be reduced, in particular for hedged share classes for which the distribution amount and NAV of any hedged share classes (HSC) may be adversely affected by differences in the interests rates of the reference currency of the HSC and the base currency of the Sub-Fund. Dividend payments are applicable for Class A/AM/AMg/AMi/AMgi Dis (Annually/Monthly distribution) and for reference only but not guaranteed.  Positive distribution yield does not imply positive return. For details, please refer to the Sub-Fund’s distribution policy disclosed in the offering documents.


Please indicate you have read and understood the Important Notice.