
Equity
Ten Reasons to (re)consider China Equities


The last decade has been a rollercoaster for China equity investors. Shifting policies, geopolitical tensions, and uneven growth have driven sharp market swings.
In our view, however, investor sentiment has swung from excessive optimism to undue pessimism. While the last few years have certainly been more challenging given the macro environment, nonetheless China has made significant advances which, until recently, were underappreciated and undervalued.
In this context, the recovery over the last year has been encouraging. We see this as the start of a more sustained rebound. Below we outline 10 reasons why we think investors should reconsider China equities both in terms of their potential for long term returns and also the contribution they can make towards a balanced portfolio of global equity investments.
1. Underappreciated technology – China’s “AI Leap Forward”
In January 2025, DeepSeek shook financial markets when it announced the development of an AI model with the same functionality as ChatGPT but seemingly at a fraction of the cost.
Indeed, DeepSeek’s announcement has been one of many that illustrate China’s advancement across a range of technology and AI-related capabilities, including areas such as humanoid robots, autonomous driving, renewable energy and biotech.
The key takeaway is that China’s technology capabilities are far more advanced than was previously understood. As China’s technological progress becomes increasingly visible, we expect that this will lead to a diverse range of investment opportunities.
2. ”Don’t fight the PBoC”
The phrase “Don’t fight the Fed” was coined back in 1970, highlighting the strong correlation between US Federal Reserve policy and the direction of the US stock market. A modern reinterpretation in the context of China could be “Don’t fight the PBoC”.
Key to the market turnaround over the last year has been an important shift in government policy towards a more pro-growth stance. One feature has been an explicit objective of stabilising asset prices. This has included buying domestic ETFs in size, as well as the People’s Bank of China (PBoC) signalling it would act as lender of last resort to backstop the market by extending significant amounts of credit for stock repurchases.
We see this as clear evidence of a ‘Beijing Put’. That is, the government stepping in to provide strong downside protection, if needed, for China A-Share markets in particular.
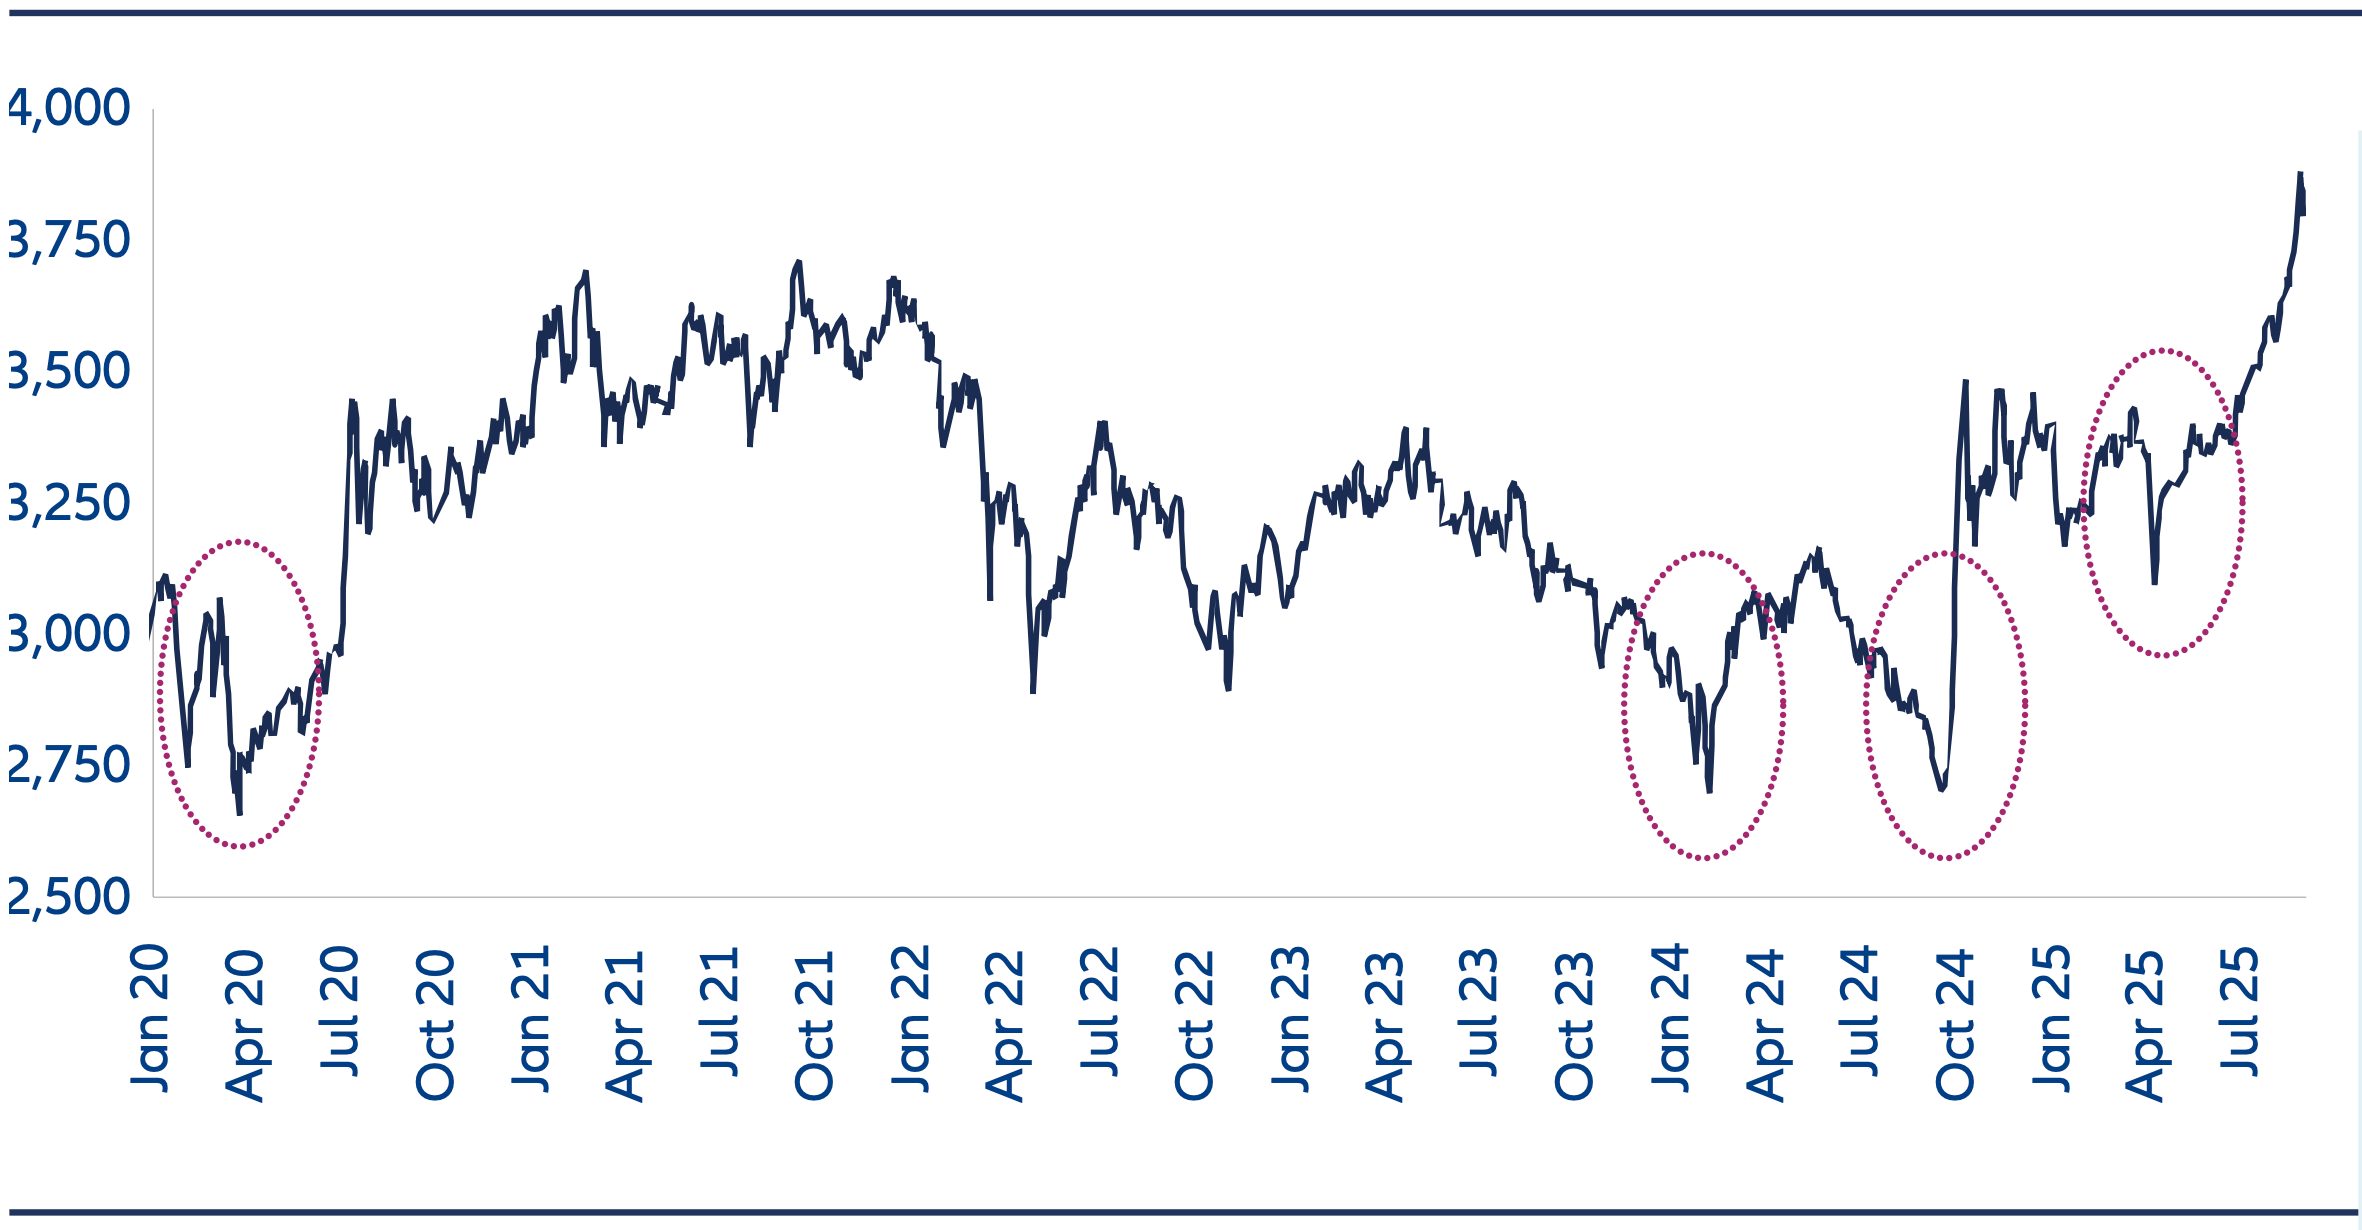
Chart 1: Shanghai Composite Index, 5 years
In recent years, the Shanghai Composite has not traded significantly below the 3,000 level for a sustained period.
Over the last year, the government has signalled support for the equity market through buying domestic ETFs in size to cushion the volatility. Most recently, in April 2025, the so called “national team” again stepped in to support domestic stocks following tariff-related weakness.
Source: Wind, Allianz Global Investors, as of 31 August 2025. The information above is provided for illustrative purposes only, it should not be considered a recommendation to purchase or sell any particular security or strategy or an investment advice. Past performance, or any prediction, projection or forecast, is not indicative of future performance.
3. Domestic flow of funds
Foreign investors only own around 3% of the China A-Share market. Domestic investors are therefore the key price setters.
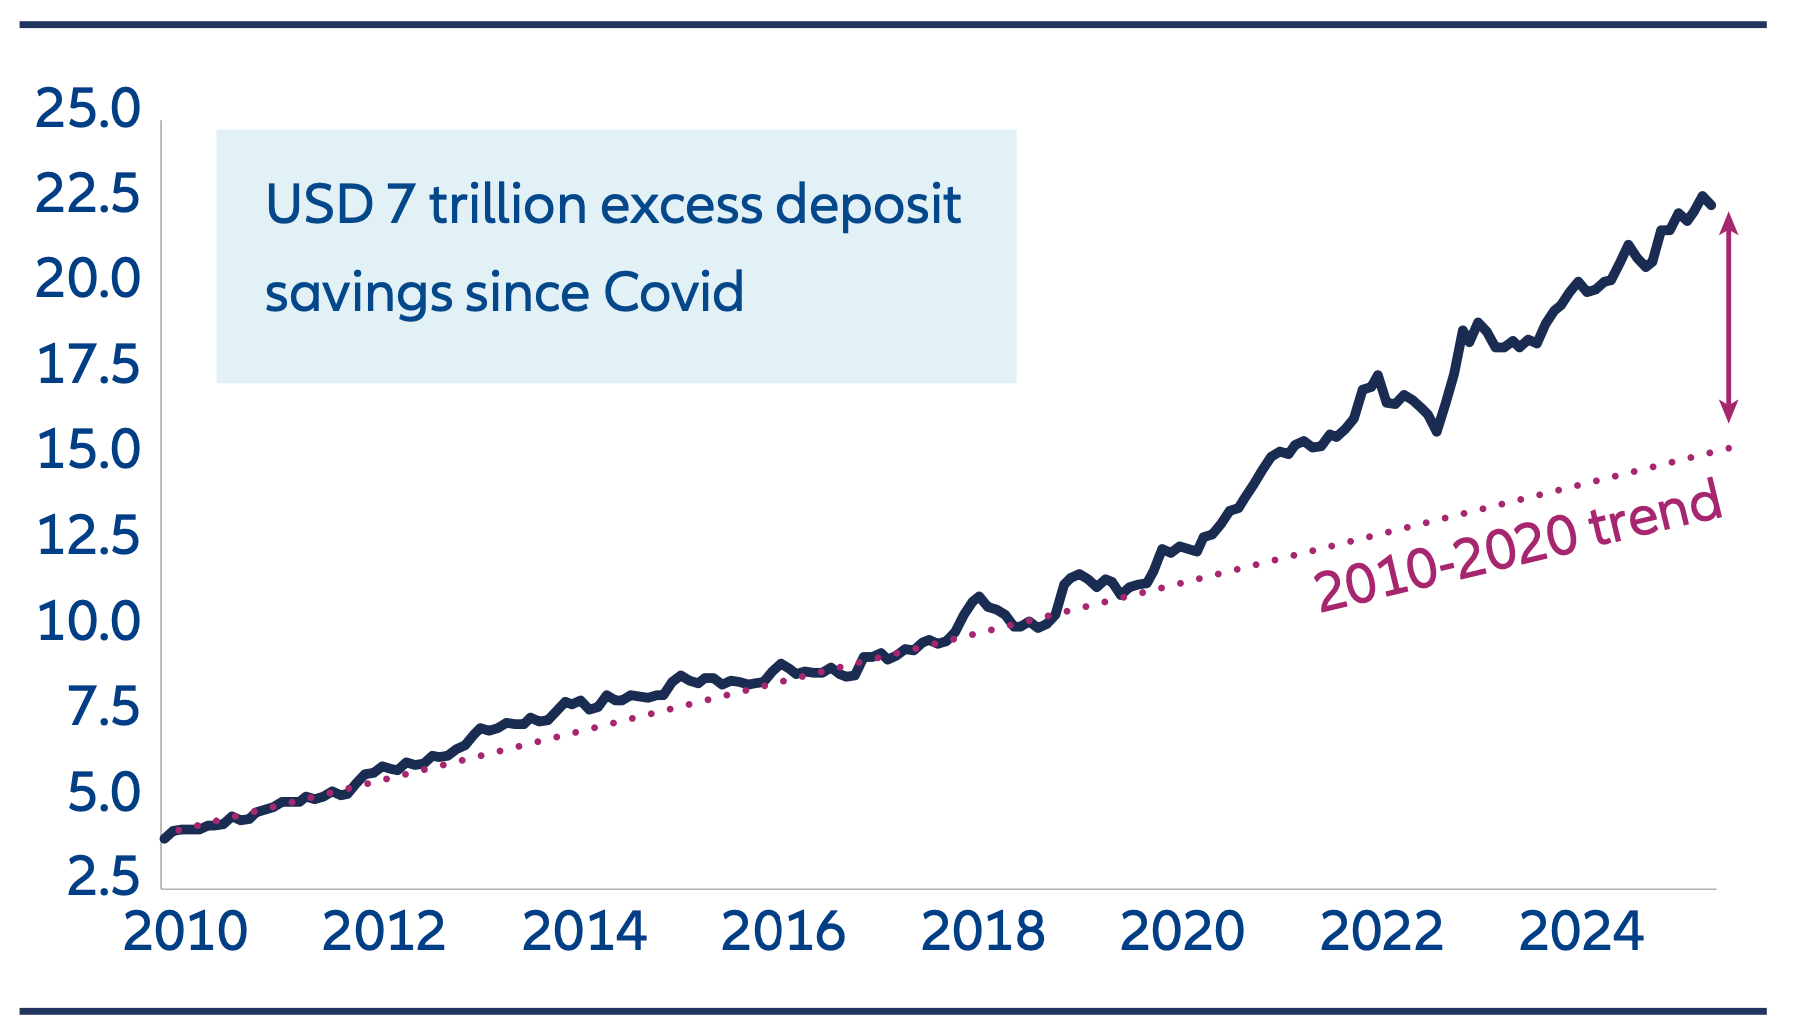
A key change in the market recovery has been the return of China’s retail investors, who, until recently, have largely stayed on the sidelines. Bank deposits have ballooned over the last few years reflecting macroeconomic weakness, increased job uncertainty, and the decline in house prices. As a result, there are around USD 7 trillion of “excess savings”. That’s about half the size of the China A-Share market. With bond yields and deposit rates having fallen to record low levels, this is triggering a reallocation into domestic equities.
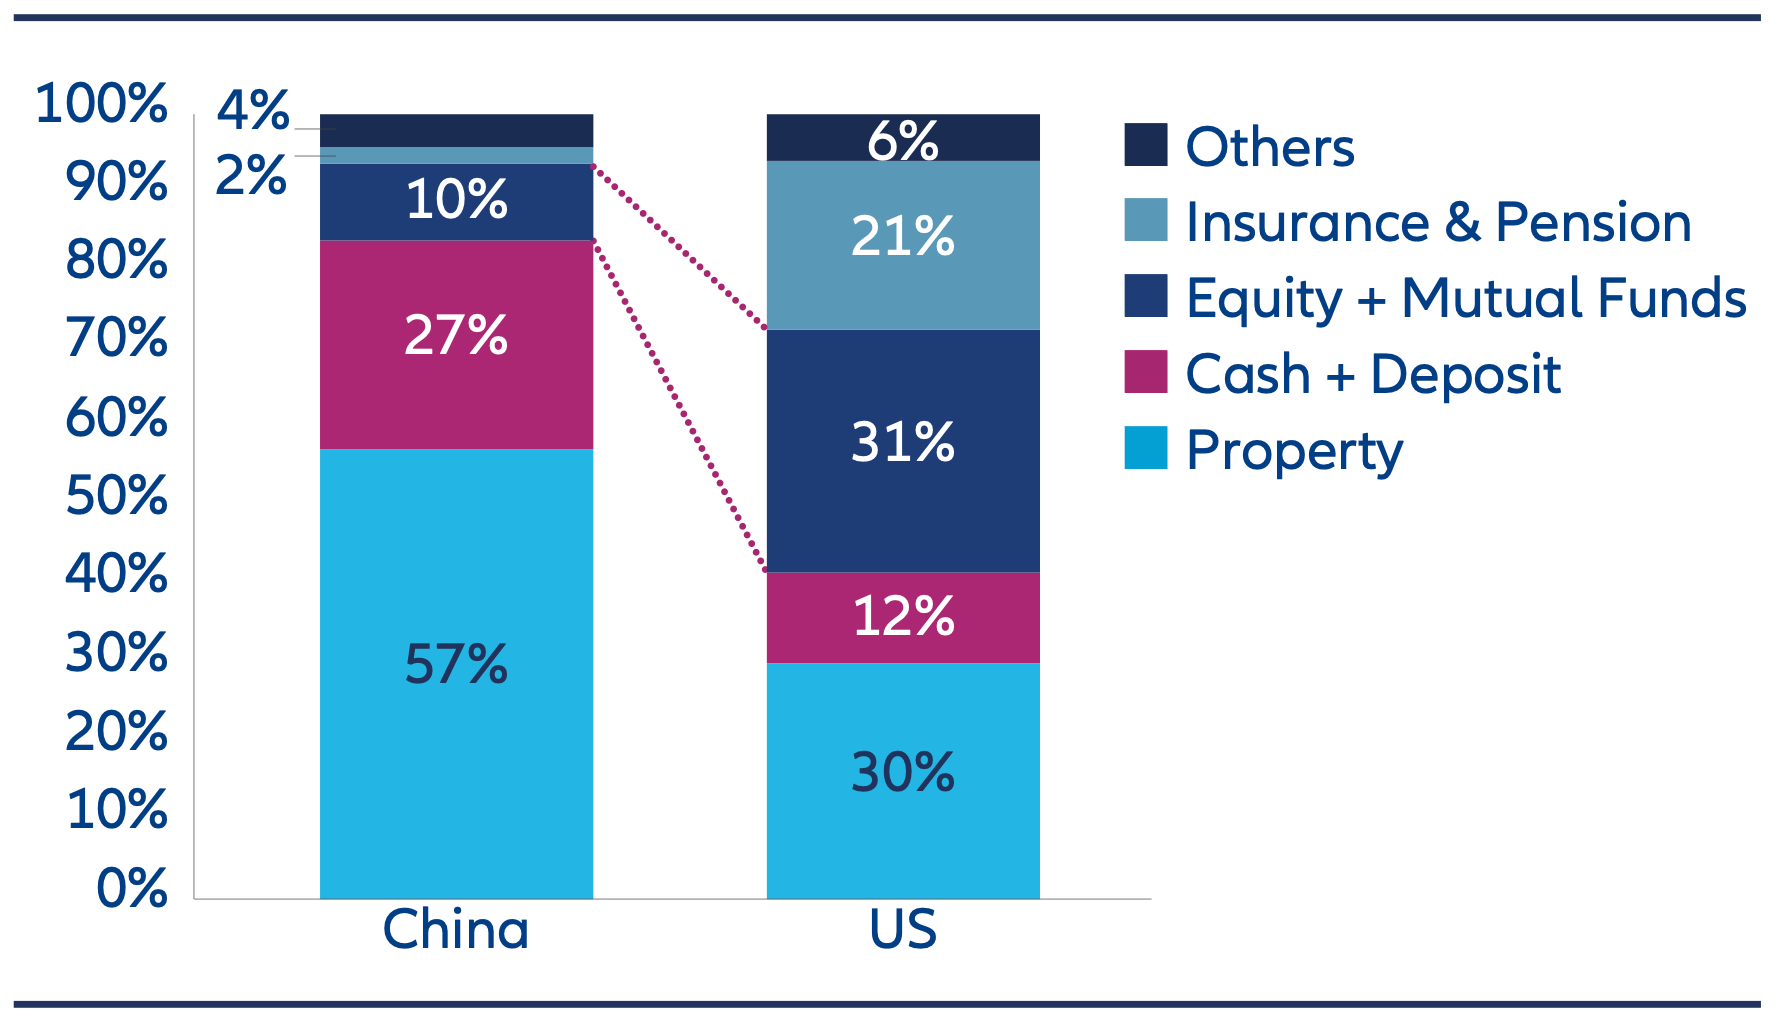
Long term, we believe institutional investors such as insurance companies and pension funds will also increase their equity allocations. Current levels are significantly lower than developed market peers.
Chart 2A: Household bank deposits in mainland China (USD trillion)
Source: Wind, HSBC, Allianz Global Investors, as of 31 July 2025.
Chart 2B: Composition of household total assets of China vs US
Source: NFID, CEIC, Wind, Goldman Sachs Global Investment Research, Allianz Global Investors, as of 31 December 2024.
4. Increasing share buybacks, higher dividends
It’s not only retail investors in China that have high cash levels – corporates do as well. Chinese companies in aggregate (ex financials) have around USD 2.4 trillion of cash on their balance sheets. This is equivalent to around 21% of their prevailing market cap – higher than most other global markets.7
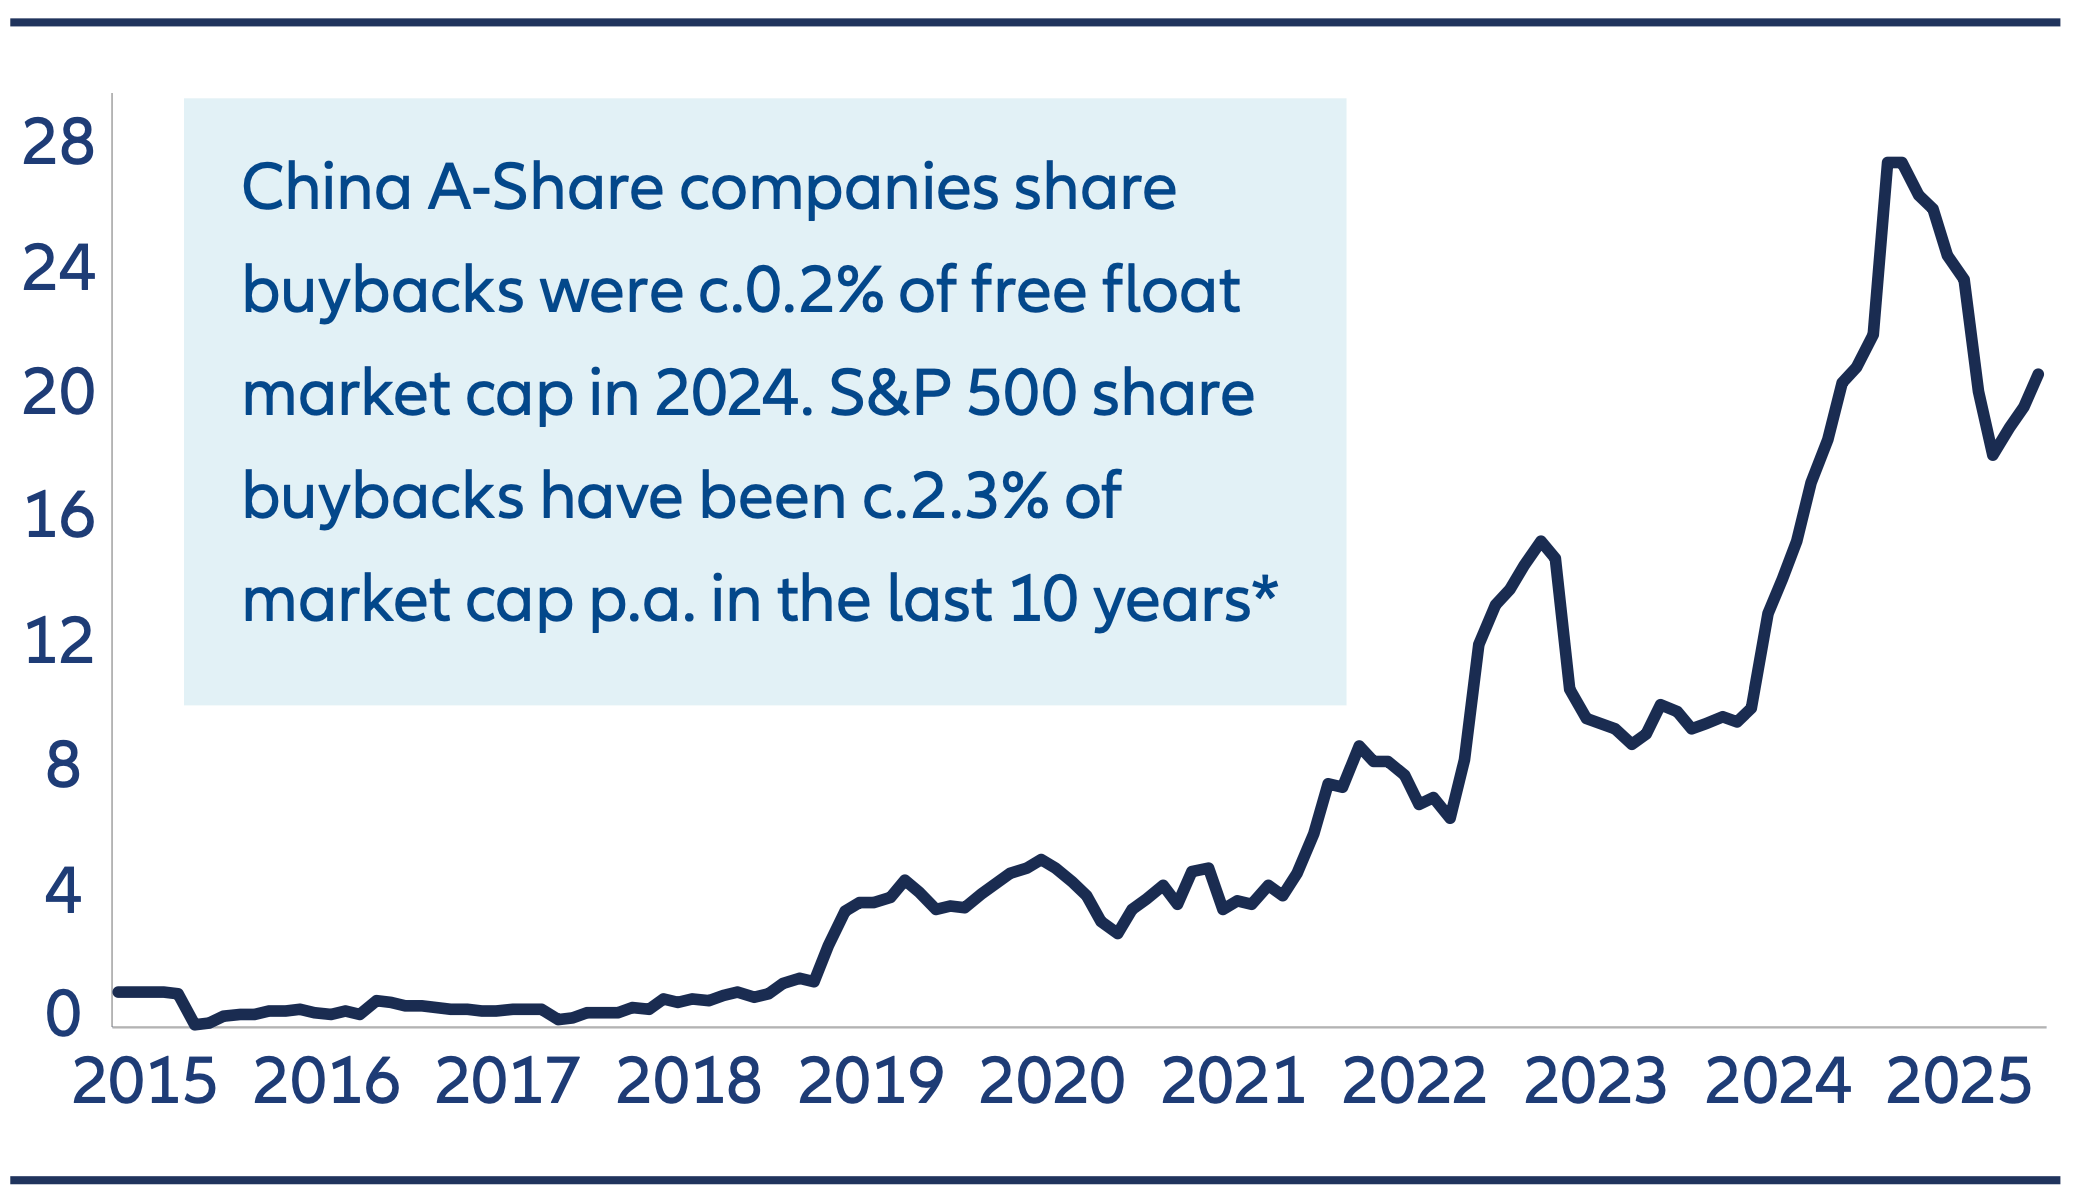
As a way of increasing the attractiveness of equity markets, regulators have taken action to enhance shareholder returns. Share buybacks in China A-Shares reached record levels in 2024. While many companies previously only paid dividends once a year, a growing number have announced the addition of interim dividends going forward. More regular cash payments should be an appealing feature, especially for retail investors.
Chart 3A: China A-Share buyback volume (CNY billion, 6 months moving average)
Source: Wind, Allianz Global Investors as of 31 August 2025. *HSBC, Bloomberg, Wind as at 31 December 2024.
Chart 3B: China Equities – Cash-to-Market Cap and Dividend Payout Ratios (As of FY24 Result)
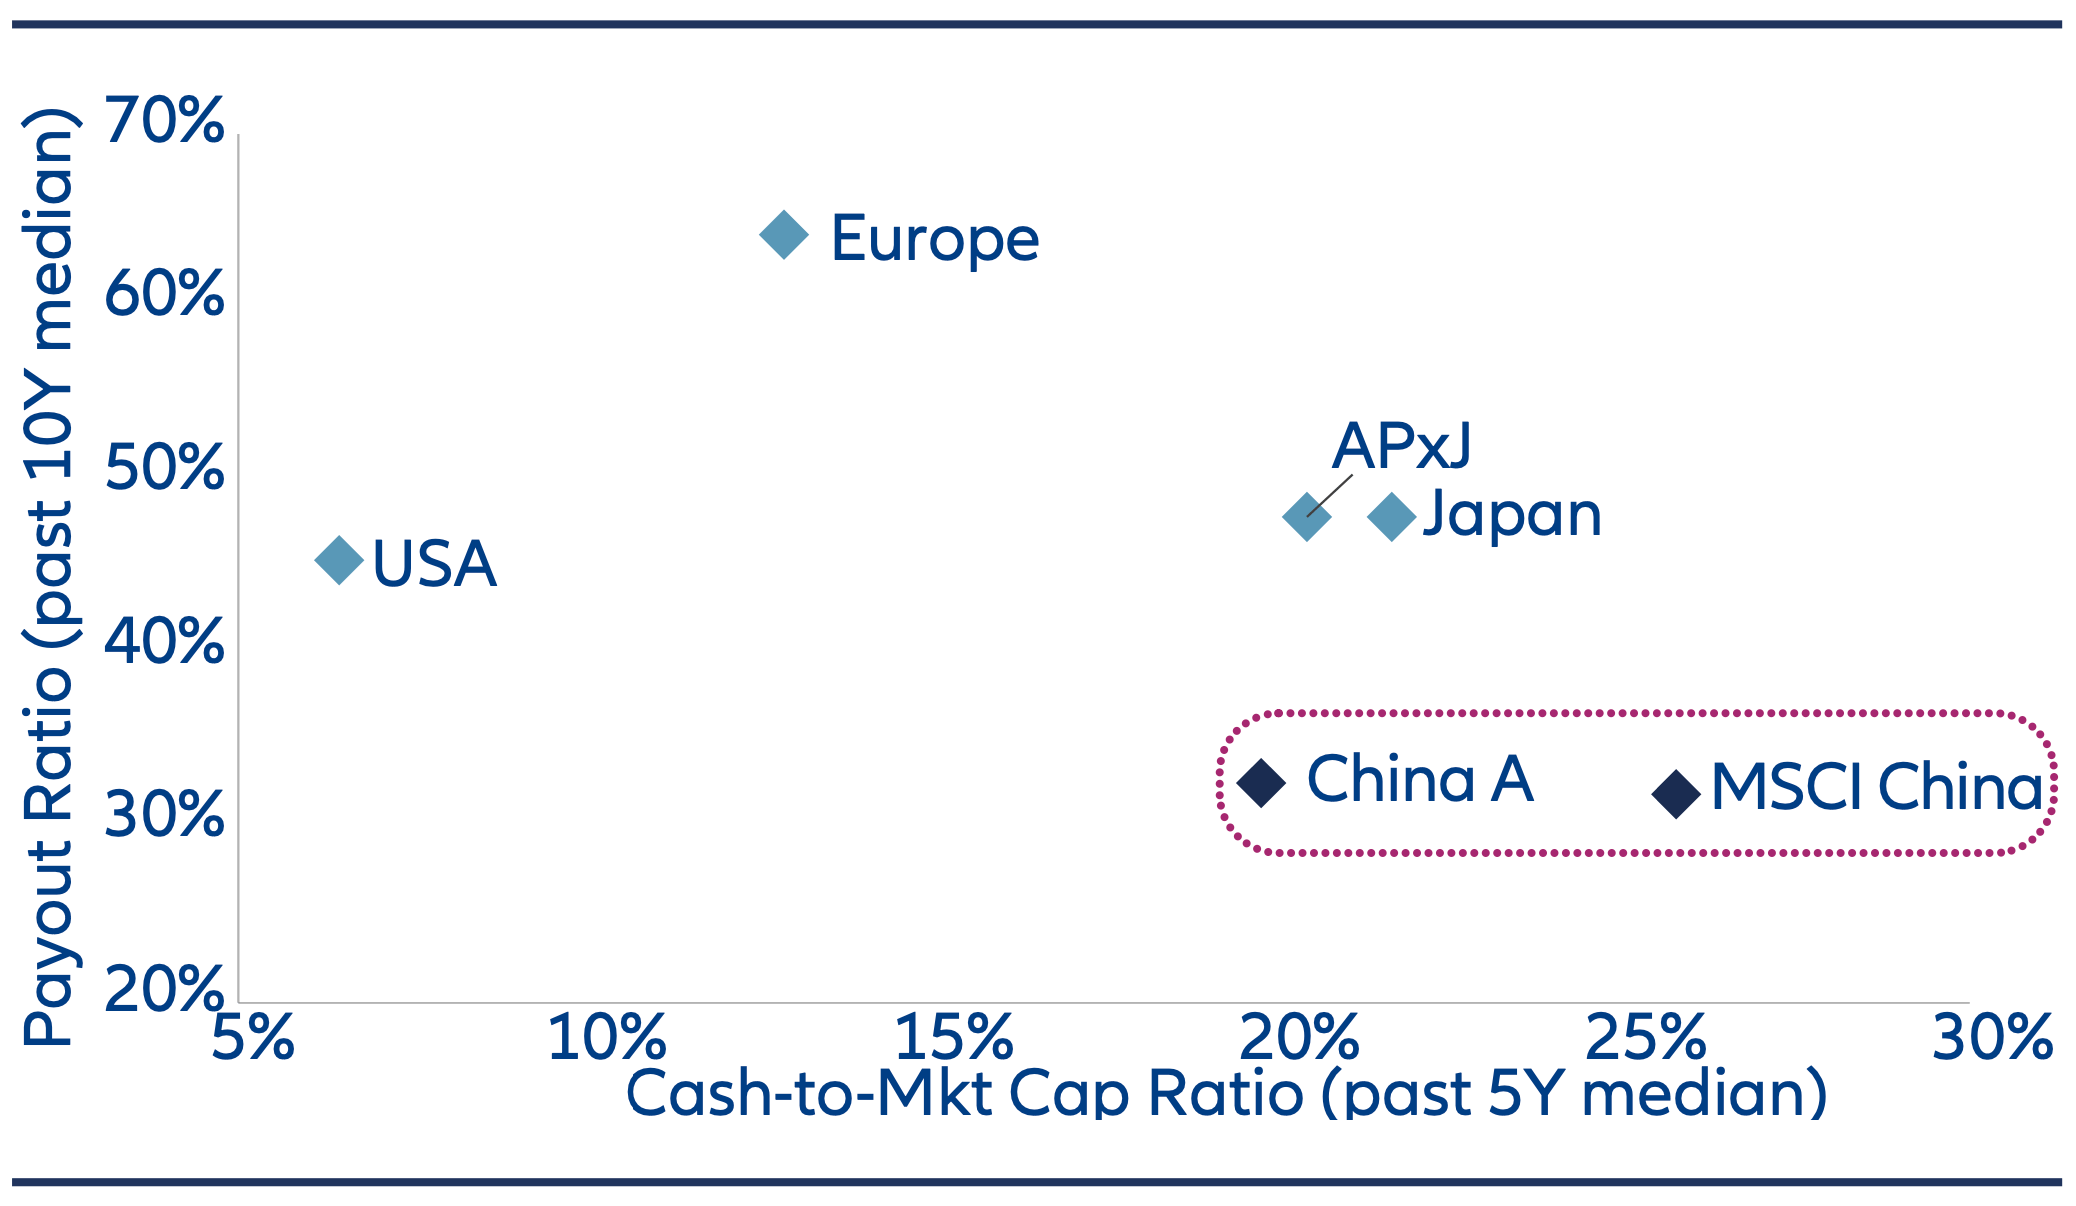
Source: Goldman Sachs as of 14 May 2025;
5. Reduced level of equity issuance
Since the beginning of 2024, measures have been taken to address the high level of equity issuance, which had long been a headwind for the China A-Share market. Mainland China and Hong Kong’s combined stock market capitalization has surged from less than USD 1 trillion in 2003 to currently around USD 16 trillion.
Over this period the number of listed China A-Share companies has more than tripled to around 5,000.
Policy initiatives in 2024 focused on areas such as stricter regulation of IPOs and more forceful de-listing mechanisms. We believe this represents a structural change which sets the scene for a more favourable balance of equity demand and supply going forward.
Chart 4A: Equity issuance and share buybacks as % of China A-shares total market cap
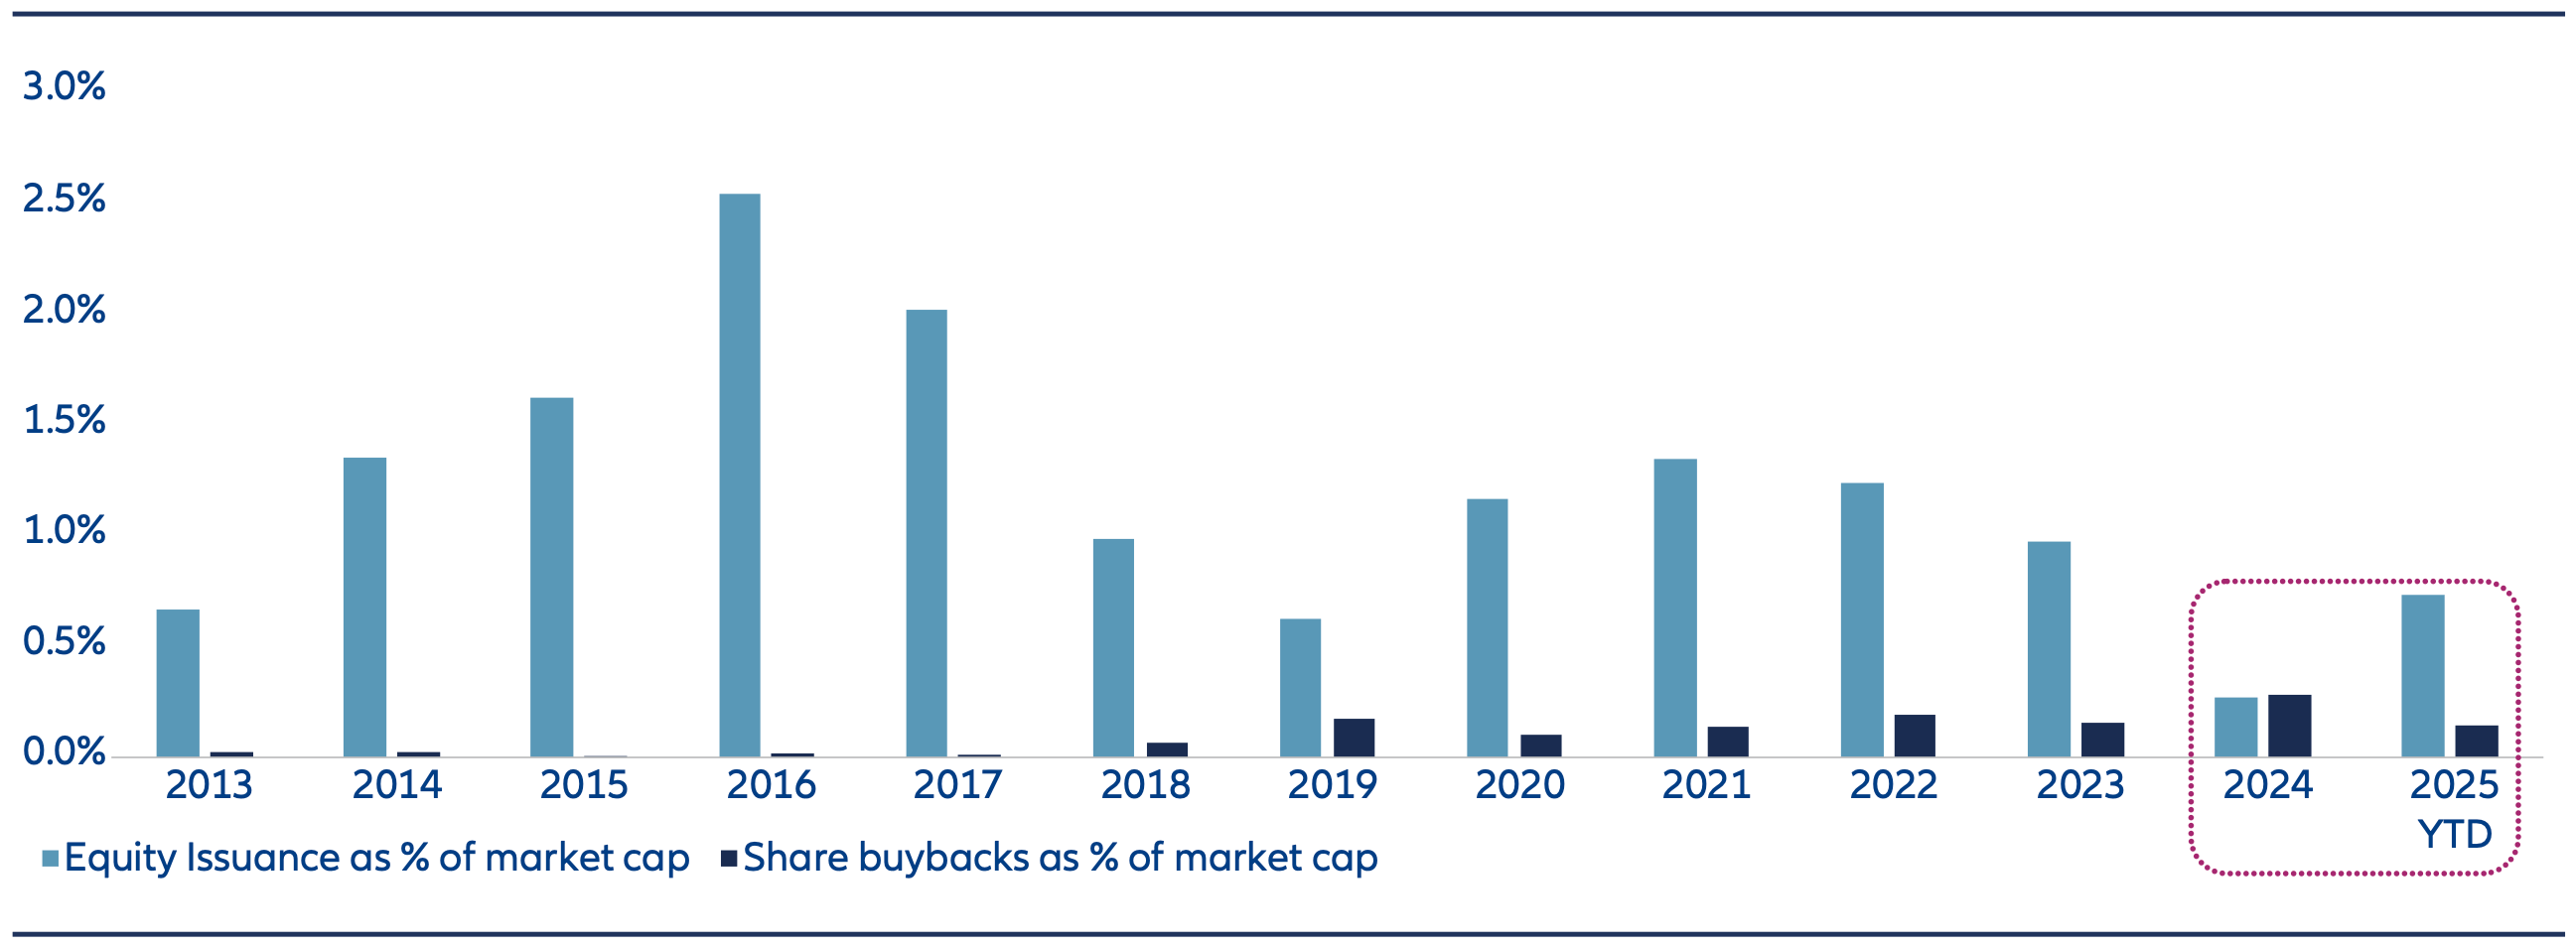
Source: Wind, Allianz Global Investors as of 31 August 2025.
Chart 4B: China A-shares net liquidity (RMB billion)
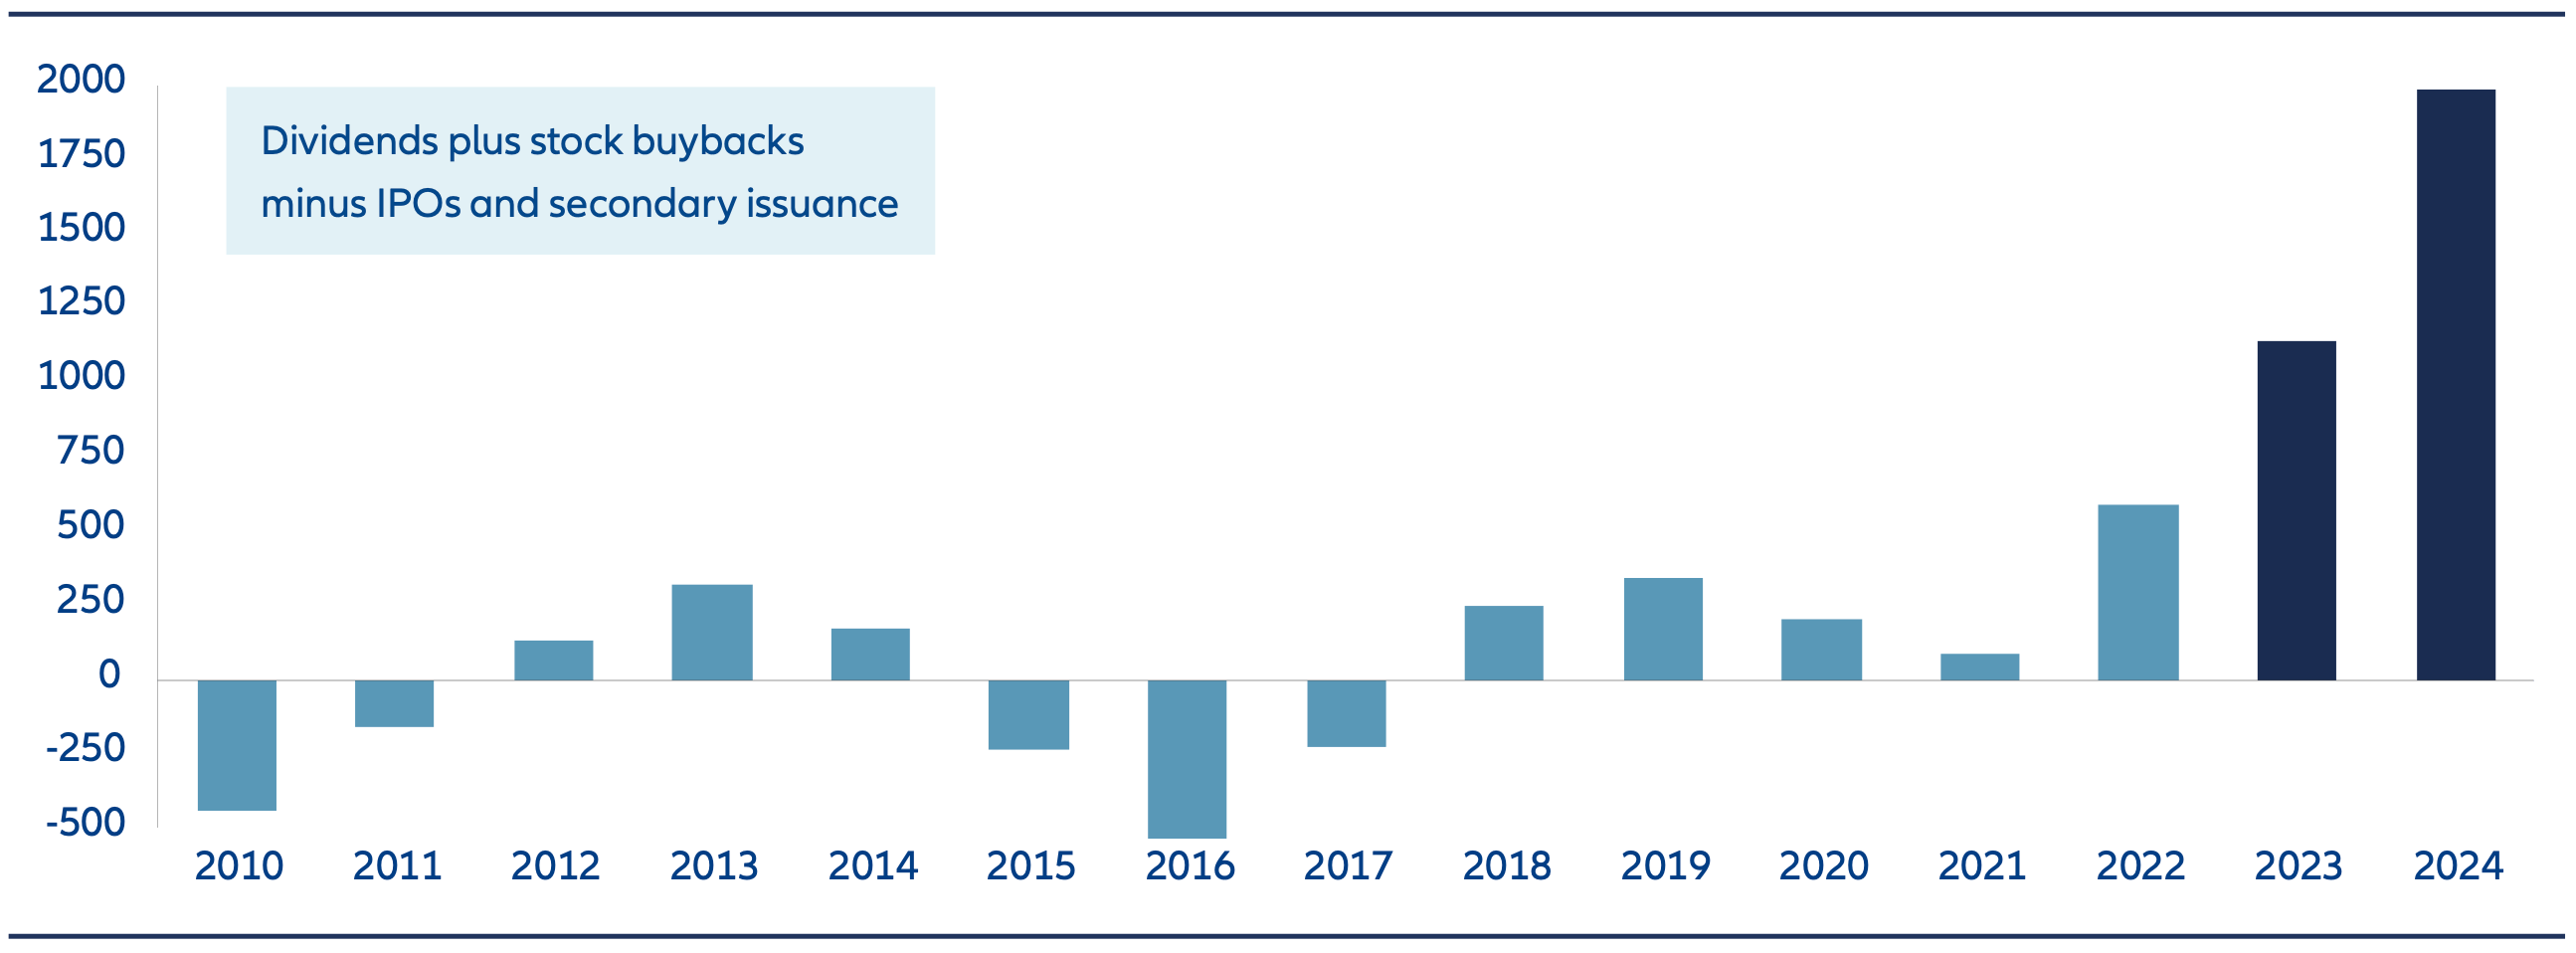
Source: Wind, Gavekal, as at 31 December 2024. IPO refers to Initial Public Offering. The information above is provided for illustrative purposes only, it should not be considered a recommendation to purchase or sell any particular security or strategy or an investment advice. Past performance, or any prediction, projection or forecast, is not indicative of future performance.
6. Tariff risks manageable
The future path of US-China relations remains uncertain. Nonetheless, the heightened risk seen at the time of the “Liberation Day” announcements has notably eased.
A key change has been China having a significantly stronger negotiating position as a result of its dominance in rare earth production. This would suggest a higher chance of a more substantive trade agreement – but we should remain prepared for sudden ‘jolts’.
Longer term, we believe China’s response will be an ongoing focus on national security, in particular through enhancing its self-sufficiency in critical industries. Although significant strides have been taken in the technology space, for example, key sectors such as electric vehicles remain dependent on imported chips.
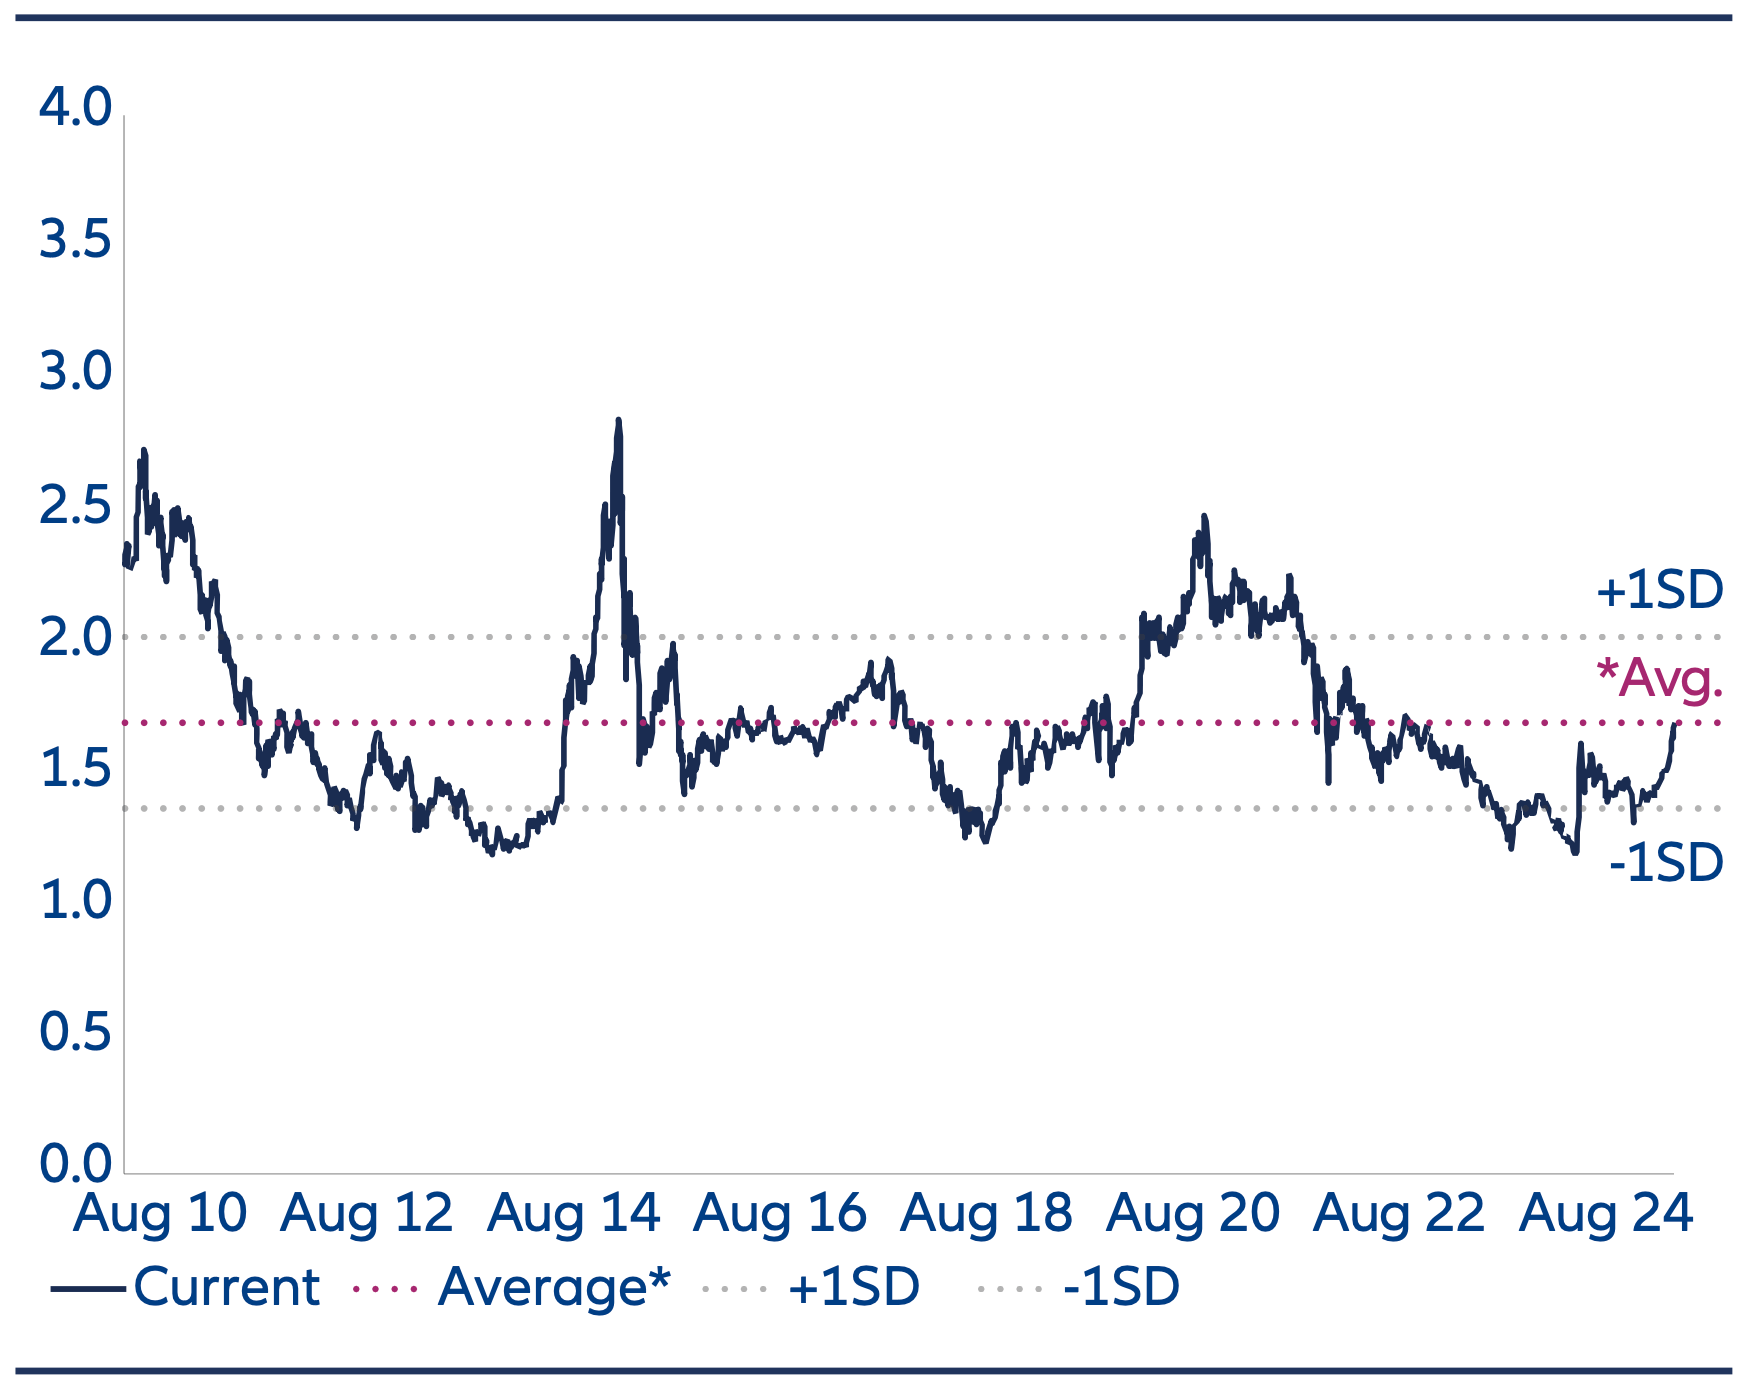
7. Reasonable valuations
The market recovery has so far mainly been led by a valuation re-rating rather than an improvement in corporate earnings. As such, valuations are no longer at the previous depressed levels.
However, valuations in our view remain reasonable and should not be a barrier to future market upside. Price-to-book valuations are around long term historical average levels. Price-to-earnings valuations are optically higher. However, when adjusted for the structurally lower interest rate environment, equity risk premia are also around average historical values.
Chart 5A: MSCI China A Onshore
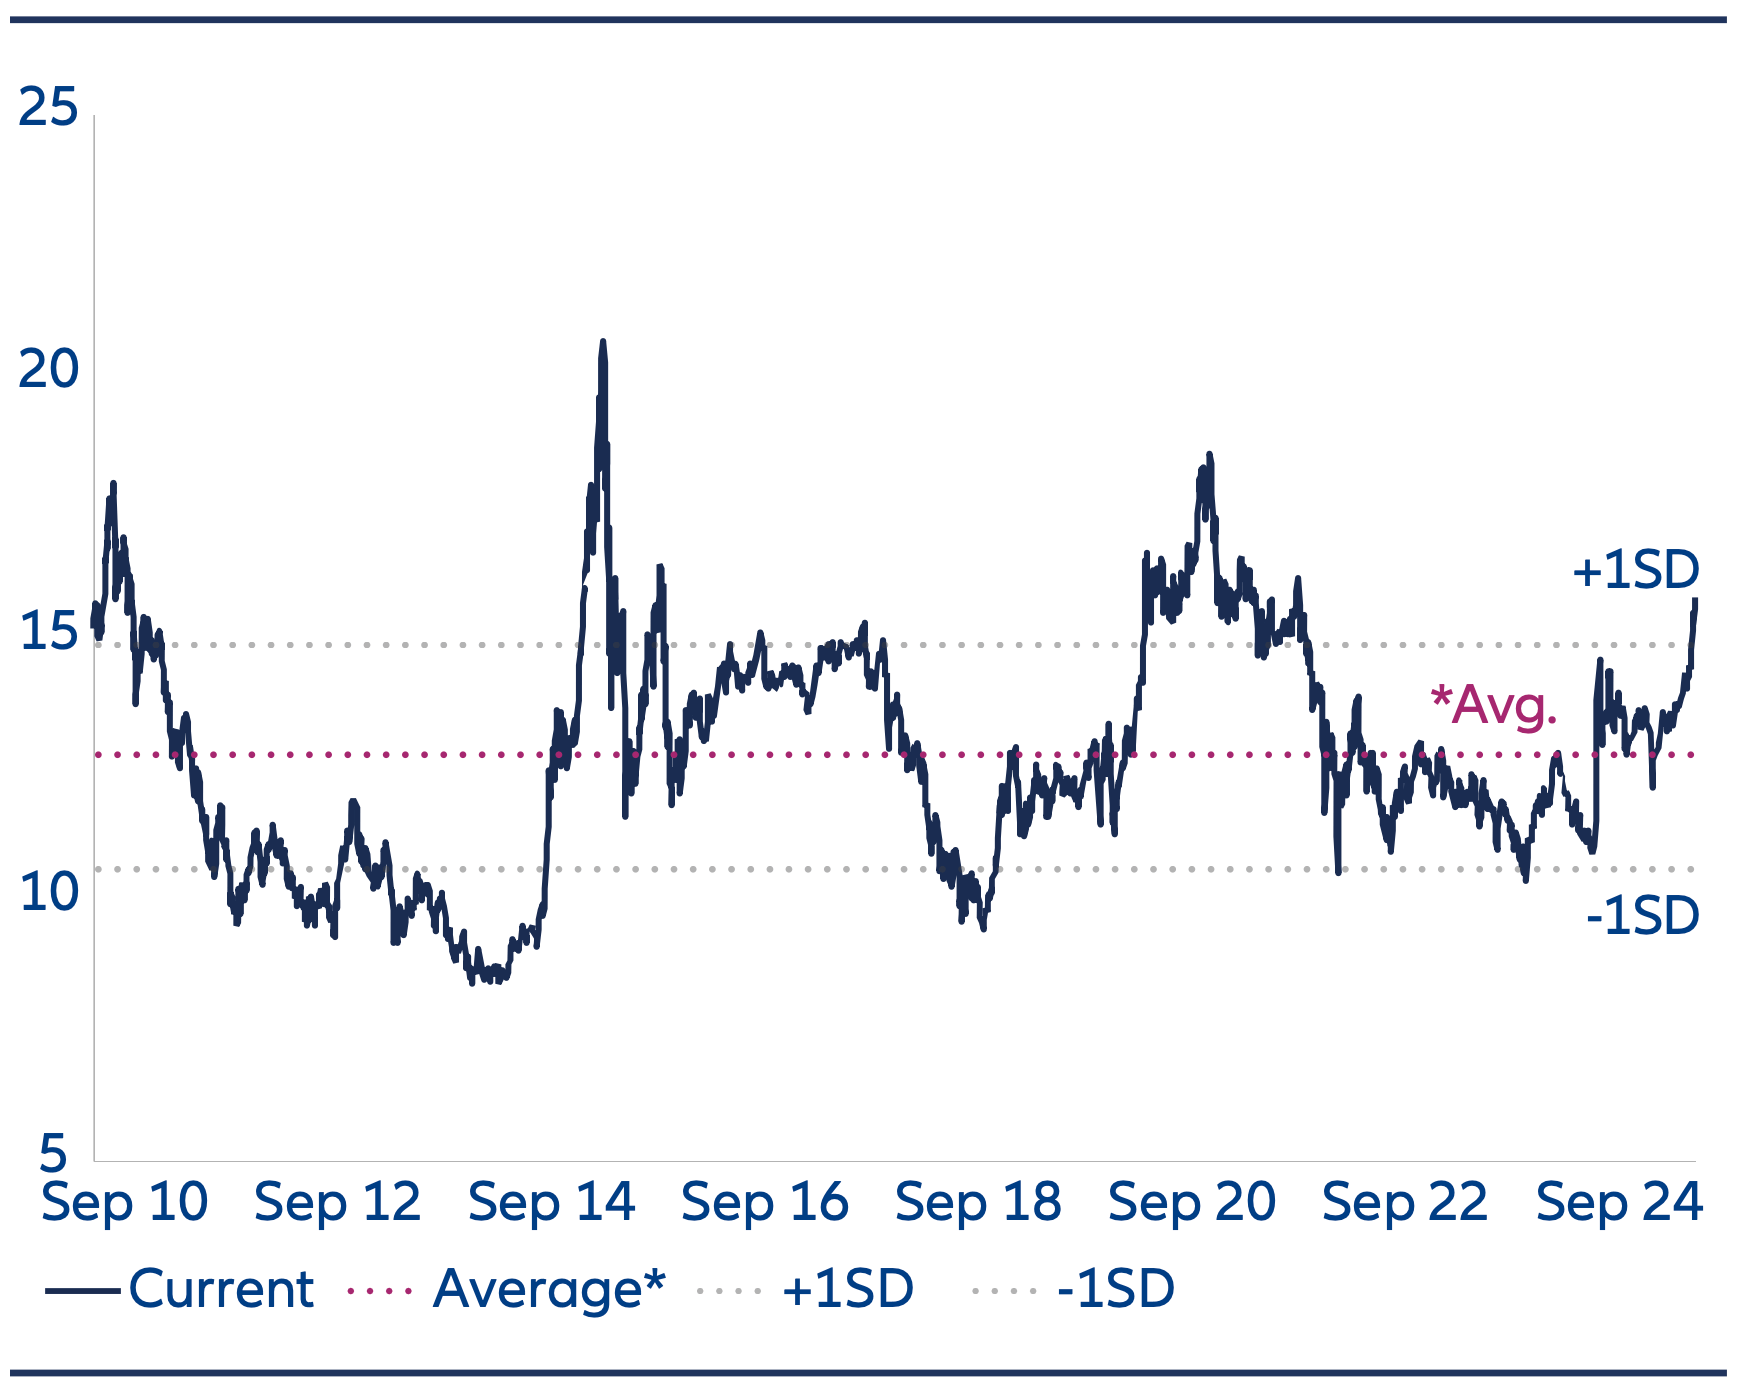
Source: Bloomberg, Allianz Global Investors, as of 2 September 2025. *The average valuation is calculated over the period of past 15 years, or since data became available. The information above is provided for illustrative purposes only, it should not be considered a recommendation to purchase or sell any particular security or strategy or an investment advice. Past performance, or any prediction, projection or forecast, is not indicative of future performance.
Chart 5B: MSCI China A Onshore – Price to Book Ratio
Source: Bloomberg, Allianz Global Investors, as of 2 September 2025. *The average valuation is calculated over the period of past 15 years, or since data became available. The information above is provided for illustrative purposes only, it should not be considered a recommendation to purchase or sell any particular security or strategy or an investment advice. Past performance, or any prediction, projection or forecast, is not indicative of future performance.
8. Divergence between macro and market
The China equity rally this year has been achieved despite a challenging macroeconomic backdrop. House prices remain under pressure and export momentum is weakening in the face of higher tariffs.
A key part of the explanation lies in a significant change in the structure of China’s equity markets. These have evolved from a previous focus on more mature, slower- growth sectors (financials, traditional heavy industry) to having much stronger representation of China’s future growth engines. The weighting of the information technology sector, for example, has almost tripled over the past decade. It now accounts for close to 25% of the China A market.
Our view is that China’s AI industry has passed a turning point and entered a more self-sustaining cycle of rising investment and higher profitability. When combined with other sectors related to areas such as advanced driver assistance systems (ADAS), robotics, biotech, the EV supply chain and so on, we see China’s equity markets increasingly reflecting the country’s emerging economic drivers.
Chart 6: MSCI China A Onshore Index – sector weightings 2015 vs 2025
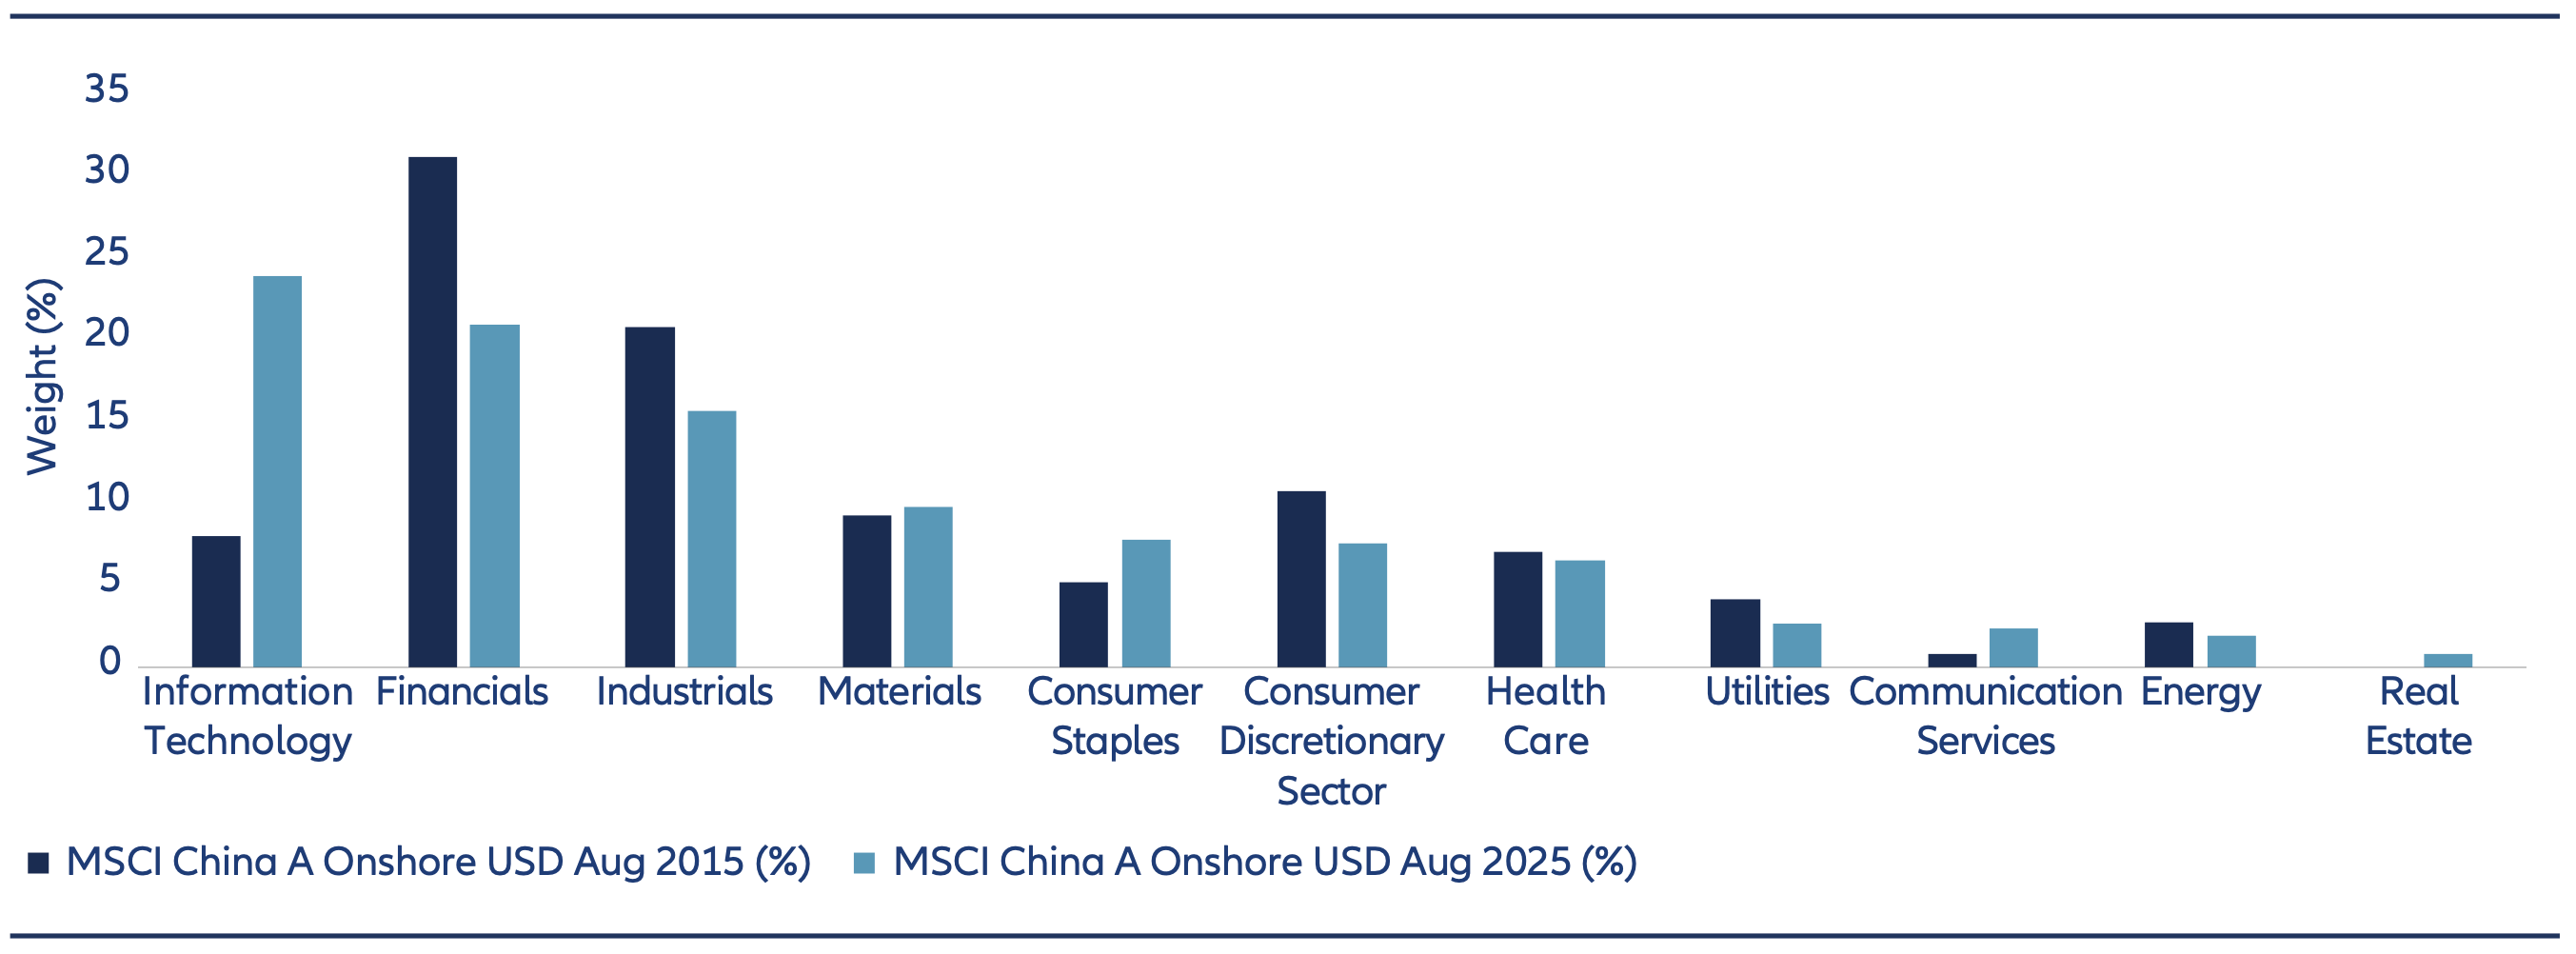
Source: IDS. Data as of end of August 2025 and August 2015.
9. Property risks increasingly in the rear view mirror
One of the key issues weighing on China equities in recent years has been risks related to the property market. While these risks still remain, our view is that the downturn in China property is nearer the end than the beginning. As such, the impact on China’s equity markets should increasingly be in the rear view mirror.
The government has implemented significant measures to stabilize the property market. This includes reducing mortgage rates, lowering downpayment ratios, and improving access to funding for cash-strapped developers.
While it will take time for confidence among homebuyers to return – indeed property prices may still have further to fall – nonetheless previous tail risk concerns have been mitigated. This is reflected in China’s bond market. The iBoxx USD Asia ex Japan China Real Estate High Yield Index bottomed in November 2023 and has returned over 85% since the low point.
10. Low correlations
China’s equity markets can be useful as a portfolio diversification tool. China A-Shares have a correlation of 0.34 with global equities over the last 10 years, which means they move in different directions almost 70% of the time. In comparison, Europe and global equities have a correlation of 0.83.
Therefore, holding China A-Shares in a global portfolio may help generate a better overall risk return profile.
Chart 7: iBoxx USD Asia ex Japan China Real Estate High Yield Index
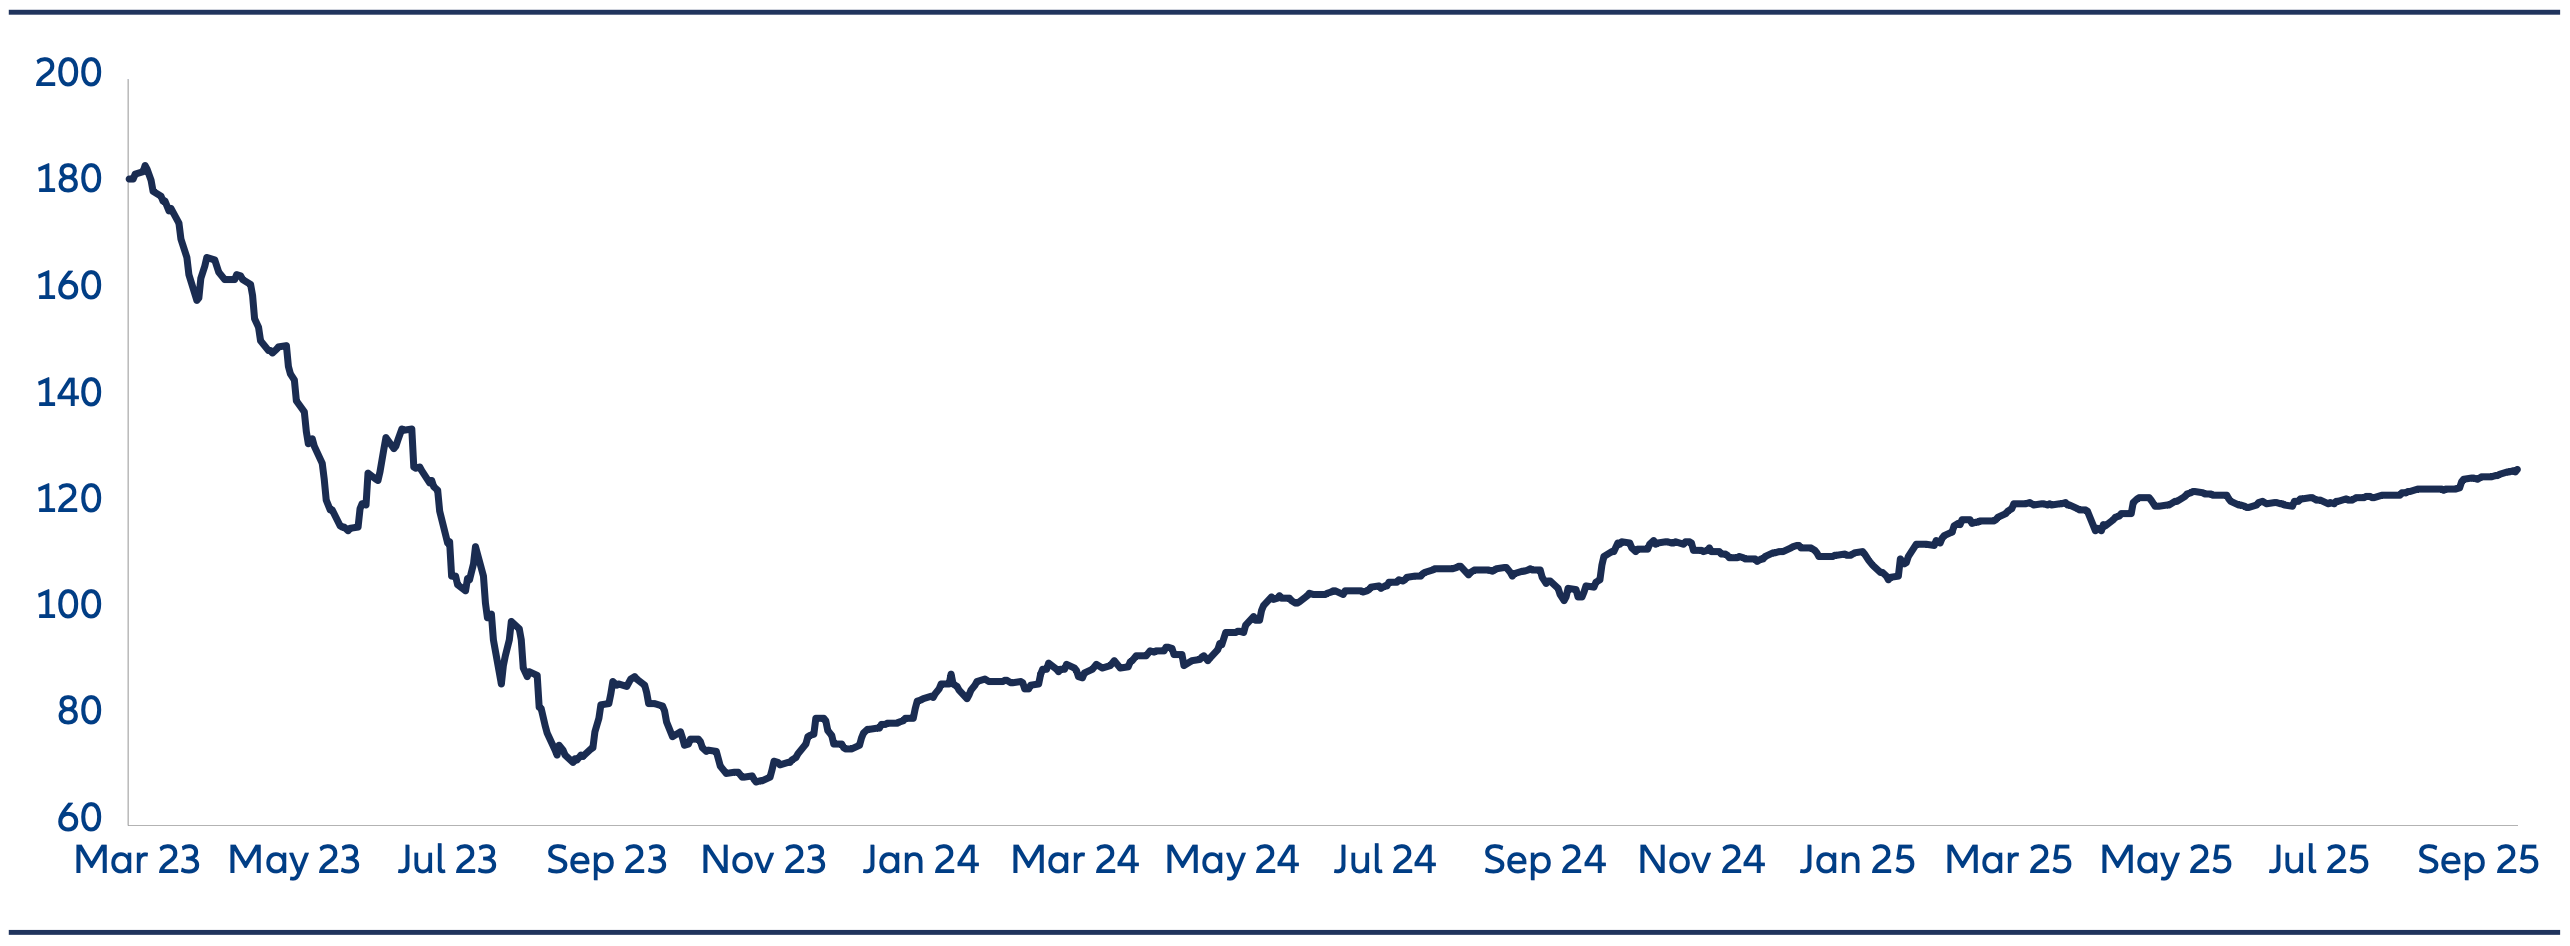
Source: Bloomberg, Allianz Global Investors as of 19 September 2025.
Chart 8: Historical correlation between major equity markets
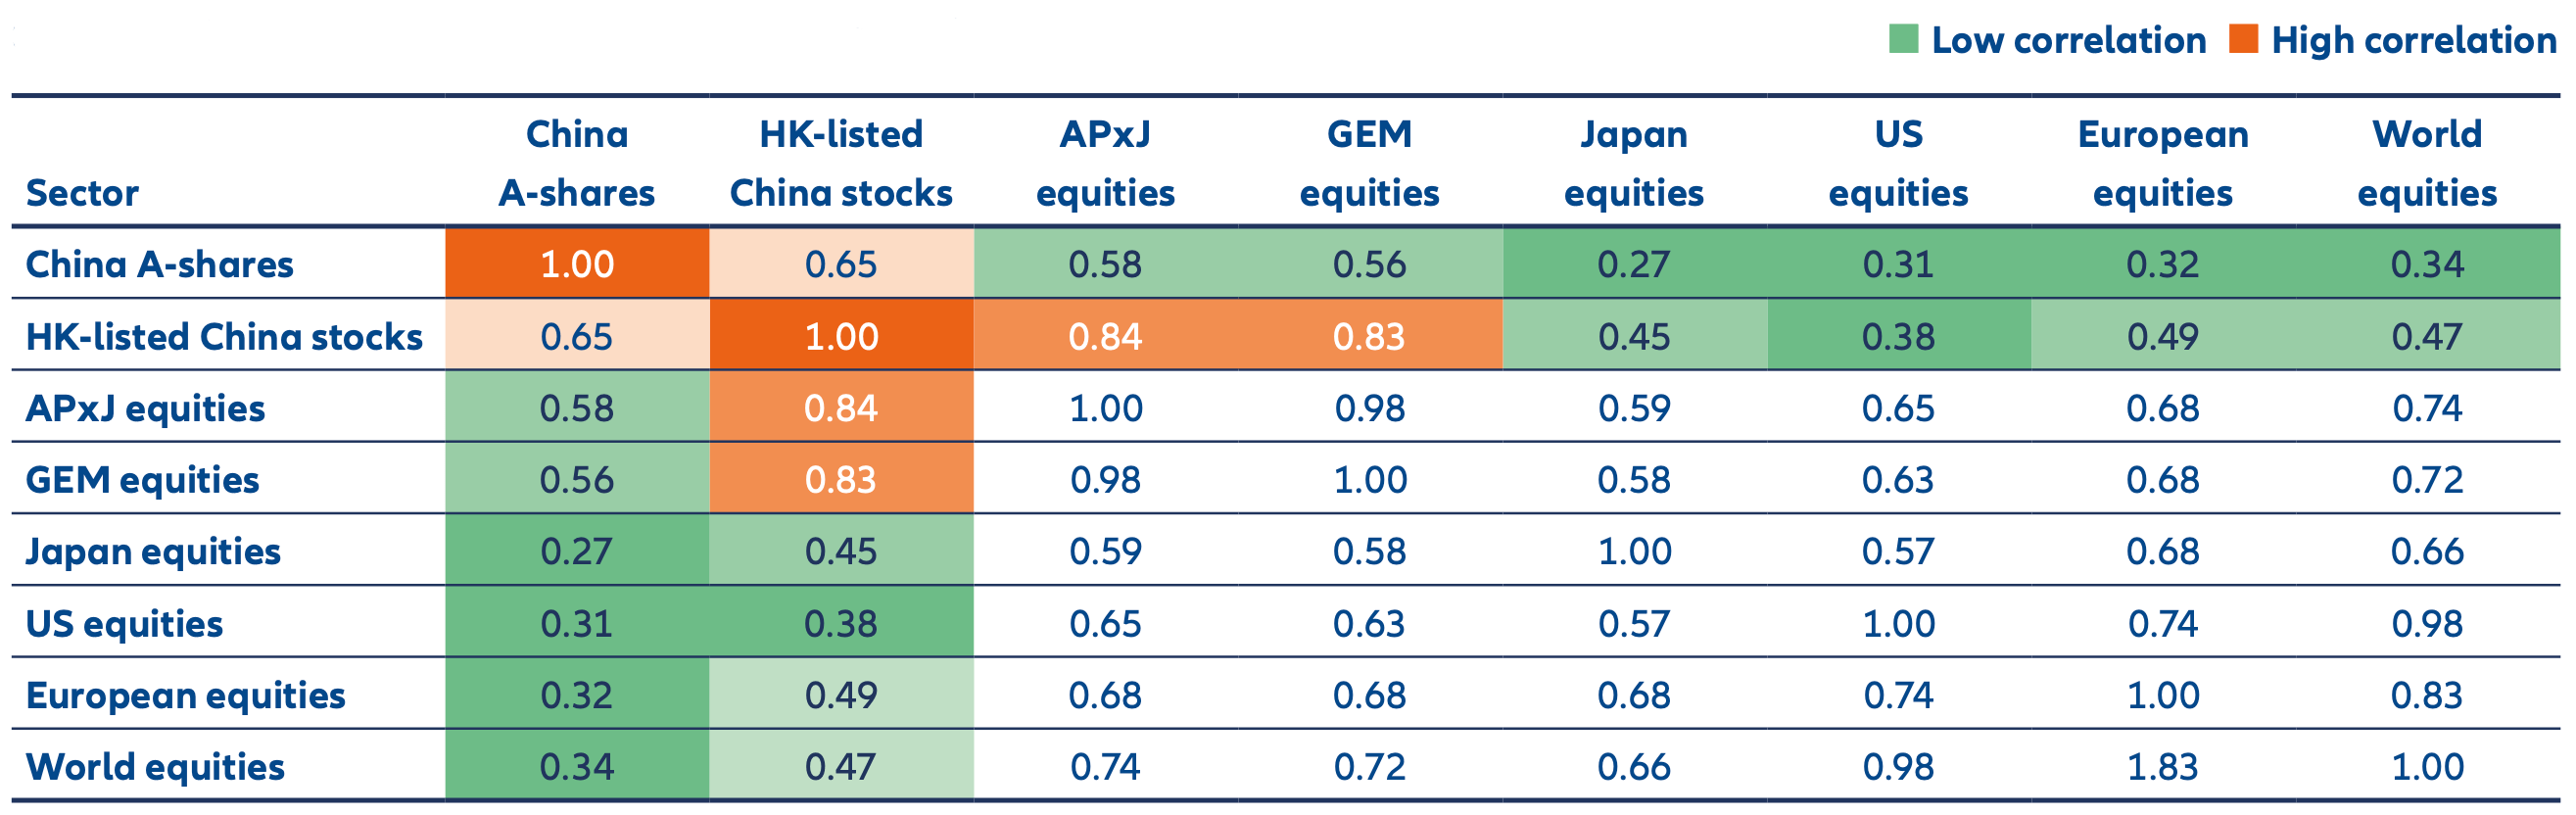
Source: Bloomberg, Allianz Global Investors, as 31 August 2025. Correlation data is calculated based on historical return of respective MSCI indices for the past 10 years, using weekly USD return. The information above is provided for illustrative purposes only, it should not be considered a recommendation to purchase or sell any particular security or strategy or an investment advice. Past performance, or any prediction, projection or forecast, is not indicative of future performance.
Summary – ‘You have to be in it to win it’
China’s equity performance over the past year offers a valuable insight for global asset allocators. Despite macroeconomic risks and geopolitical tensions, a growing number of structural drivers have supported market resilience. Many of these remain intact.
Historically, investors could also access China’s growth story through multinational firms. However, recent trends show that domestic companies are increasingly best positioned to capture the upside. As the saying goes, you have to be in it to win it.
Chart 9: Performance of major global stock market indices over last 1 year (USD, rebased to 100)
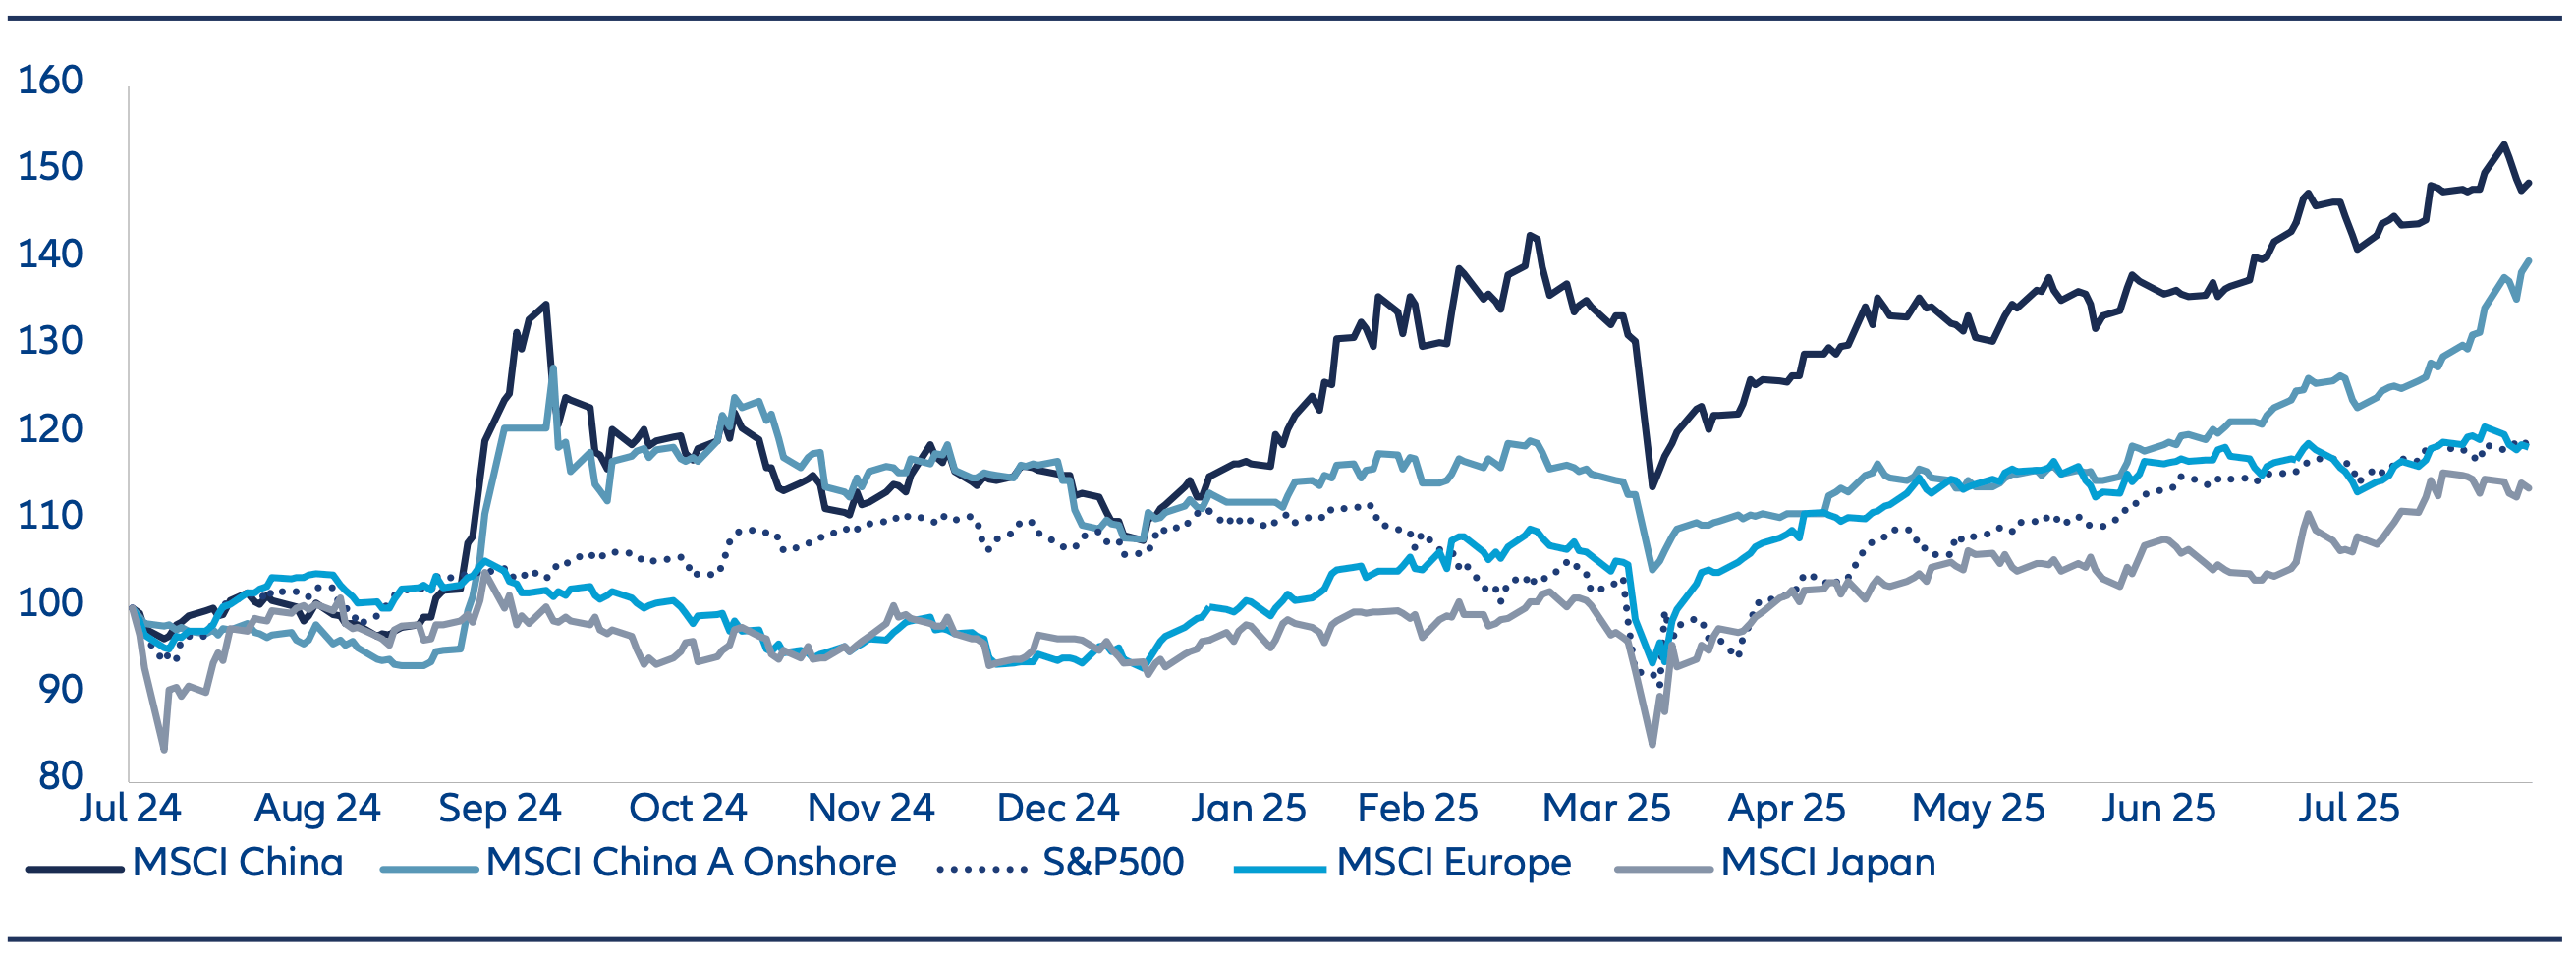
Source: LSEG Datastream, Wind, Allianz Global Investors, as at 31 August 2025. The information above is provided for illustrative purposes only, it should not be considered a recommendation to purchase or sell any particular security or strategy or an investment advice. Past performance, or any prediction, projection or forecast, is not indicative of future performance.
1EV Volumes, as of 30 June 2025
2CPIA, as of 30 June 2025
3 International Federation of Robotics, as of 24 September 2024
4Mercator Institute for China Studies (MERICS), as of April 20255
5CIC, as of 31 December 2024
6R&D World, as of 3 November 2024
7Source: Goldman Sachs, July 2025
The information above is provided for illustrative purposes only, it should not be considered a recommendation to purchase or sell any particular
security or strategy or an investment advice.


